Exploration & production: Overcoming barriers to success Decoding the O&G downturn
7 minute read
23 April 2019
Upstream oil and gas companies haven't seen their fortunes improve despite a recovery in oil prices. This confirms that the problems are more than cyclical, and reiterates the importance of high-grading portfolios across cycles.
Wall Street and its global equivalents weren’t kind to pure-play upstream and integrated oil companies when oil started falling in 2014. Nor did they reward companies enough when oil began its recovery from the lows of US$26/bbl in 2016.1 Although optimists may caution about reading too much into share price movement solely and will point toward improving productivity of companies, there seems to be more to this than meets the eye.
As against piecemeal and situational adjustments, the market expectations of seeing a deeper portfolio assessment, management, and restructuring by oil and gas producers across the cycles appear to reiterate our findings from The portfolio predicament paper published in early 2018. What can companies learn from some of the best performers in this downturn to deliver success in the eventual upturn?
Although many industry pundits have provided piecemeal perspectives across the phases of the downturn and recovery, a consolidated analysis of the past five years and a complete perspective covering the entire O&G value chain could help stakeholders—from executive to investor—make informed decisions for the uncertain future.
With this in mind, Deloitte analyzed 843 listed O&G companies worldwide with a revenue of more than US$50 million across the four O&G segments (upstream, oilfield services, midstream, and refining & marketing) in an effort to gain a deeper and broader understanding of the industry. The ensuing research yielded a six-part series, Decoding the O&G downturn, which sets out to provide a big-picture reflection of the downturn and share our perspectives for consideration on the future.
In part two of the series, we explore the state of the upstream O&G segment—assessing its overall performance, mapping actions and strategies of companies with their shareholder returns, and re-emphasizing the importance of having a future-ready portfolio.
Learn more
Create custom PDF or download the full report
Read all articles in the series—Decoding the O&G downturn
Browse the Oil, Gas & Chemicals collection
Read an article featuring these insights from Rigzone
Read an interview with Deloitte’s Andrew Slaughter
Read an article on this report from Oil & Gas Journal
Subscribe to receive related content
Underperformance in the recovery …
Between 2014 and early 2016, a free fall in crude oil prices from above US$100/bbl to US$26/bbl led to a massive breakdown in the financial performance of many oil and gas producers and even threatened their long-term sustainability.2 More than 110 North American producers, for example, filed for bankruptcy protection by the end of 2016.3 After this steep fall, the industry began its struggle to rebalance oil markets and its long march to the “new normal” of sub-US$80/bbl.
Luckily, efforts started paying off, as oil prices recovered gradually and attained the new normal by mid-2018. But did this recovery bring companies’ financials back in the black and pare the losses of investors? Although the number of bankruptcy filings reduced significantly in the past two years (2017 and 2018), 53 North American upstream companies still filed for bankruptcy in the improved oil price environment.4 Further, current stock prices of 30 percent of listed pure-play and integrated companies worldwide (with a combined market capitalization of US$550 billion) are still trading below their early 2016 levels, when oil hit at a historic low.5
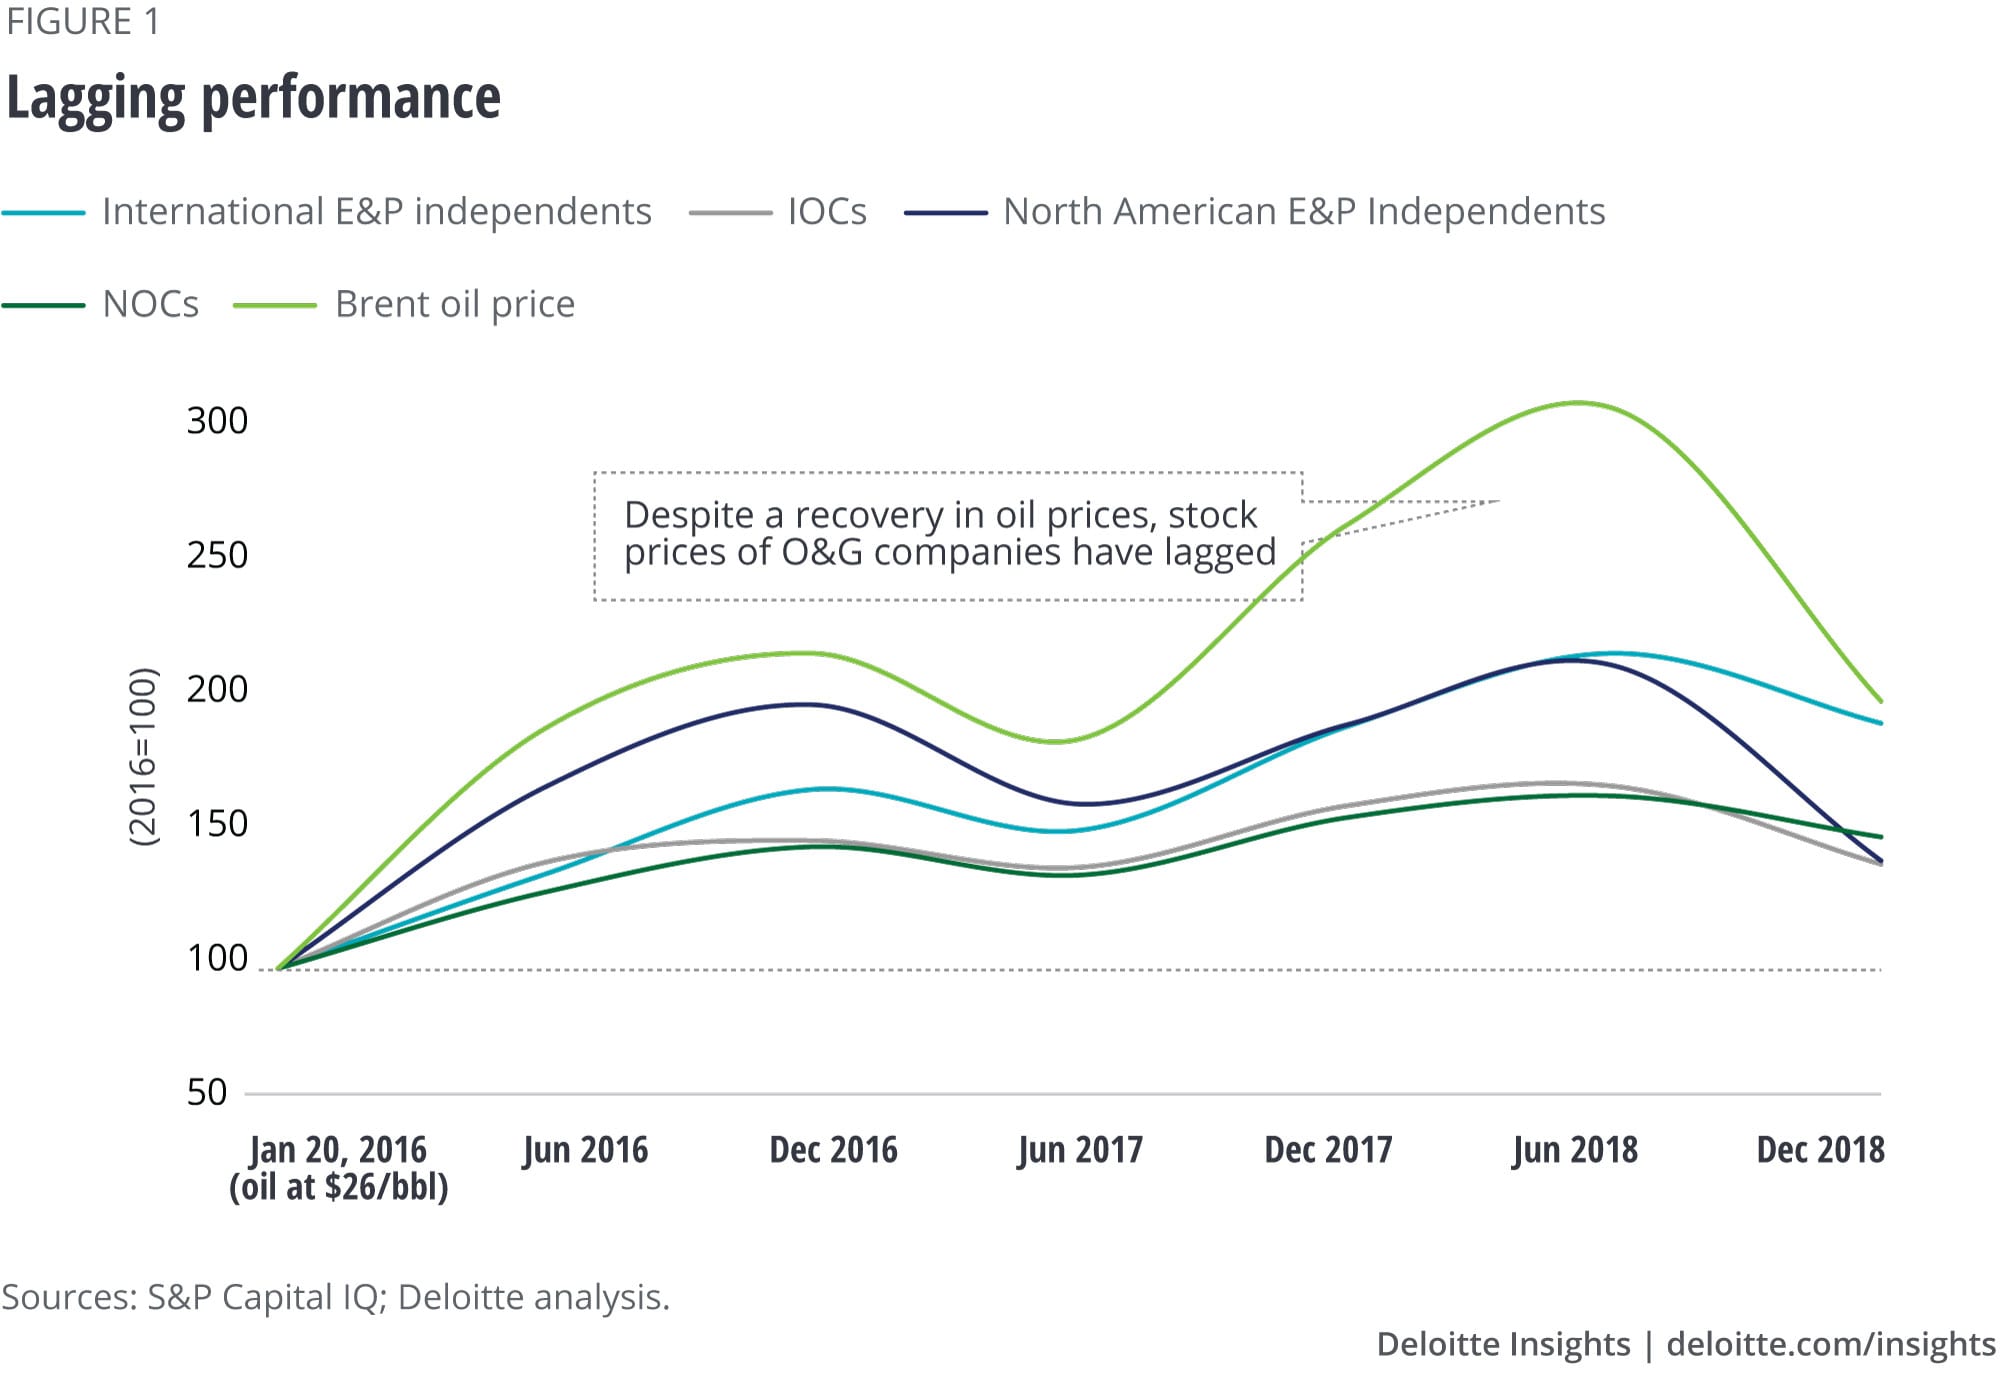
The market, which was brutal in the initial phase of the downturn, hasn’t been generous in the follow-up phase of recovery. All the four company groups (North American pure-plays, international independents, integrated oil companies, and national oil companies) have underperformed oil prices by 10–50 percent, especially North American upstream companies (figure 1).

… that too when companies were the most efficient
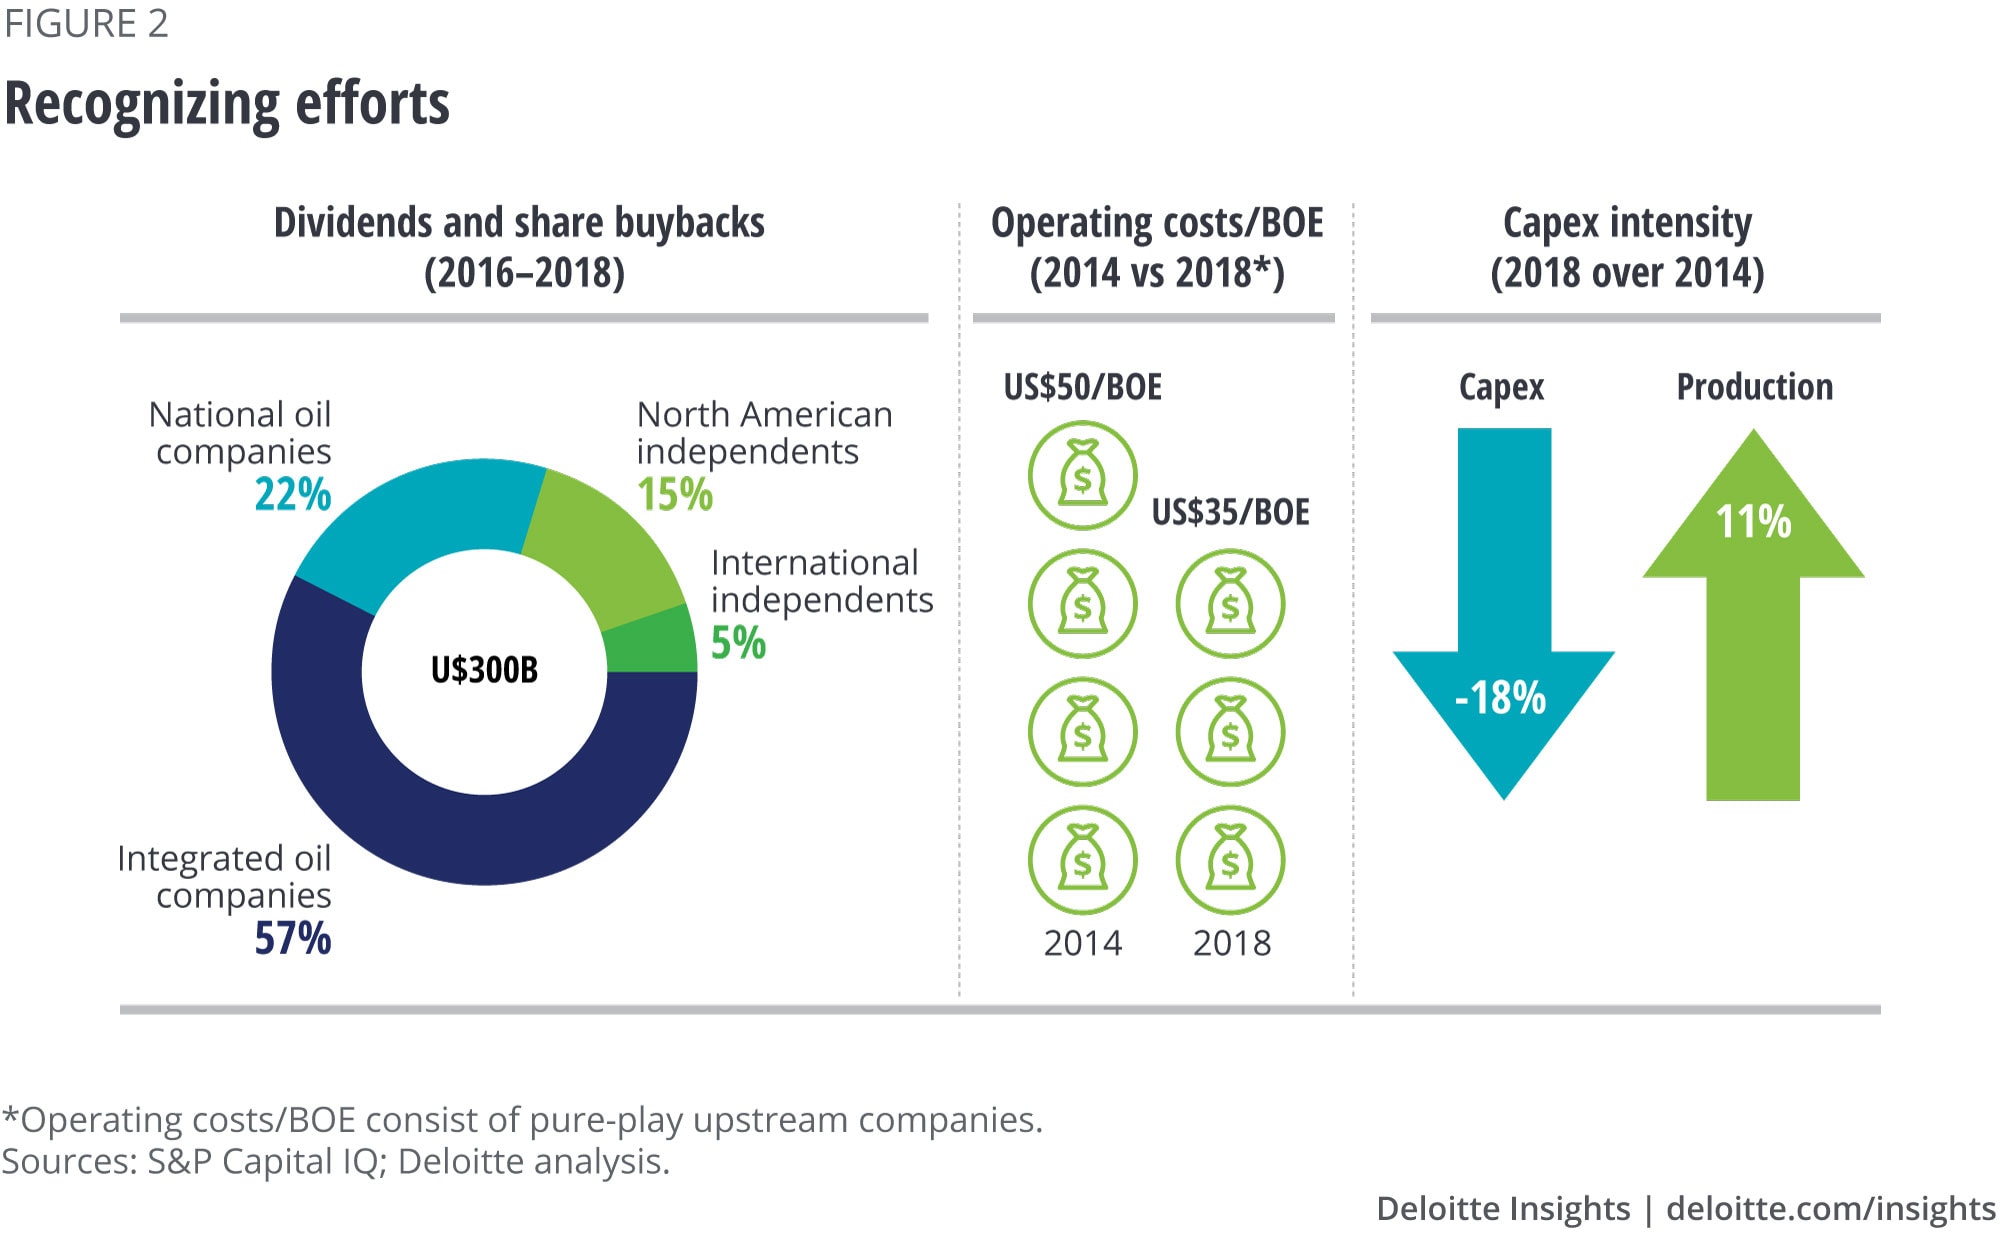
Underperformance in a recovery phase can be puzzling, especially when the worst seems to have passed. Is it because the companies didn’t do enough to course-correct themselves and adjust to the new energy reality? Were they not focused on improving their financials and growing shareholder returns? The metrics of progress, however, suggest otherwise (figure 2), questioning the industry’s worst critics and surprising the optimists over the sustained thumbs-down by the market.

In terms of dividends and sharebuybacks, the four groups returned more than US$300 billion to shareholders over the past three years (2016–2018). Even the most stressed North American independents returned close to US$25 billion in 2018. Likewise, operationally, North American independents reduced their operating costs by more than US$15/boe to about US$35/boe and they are now producing 16 million barrels of oil a day, about a third more than in 2014, with almost half the number of rigs.6 And the industry achieved all these gains with a much lower capital expenditure, or capital intensity.
In today’s efficient markets, the possibility of investors and analysts remaining oblivious to these ongoing operational gains of upstream companies is minimal. As shareholder returns are seen as the barometer of a business’s success, the market’s thumbs-down can’t be without reason. Is there a specific financial outcome resulting from these operational gains that didn’t go down well with the market?
The sum is greater than the parts
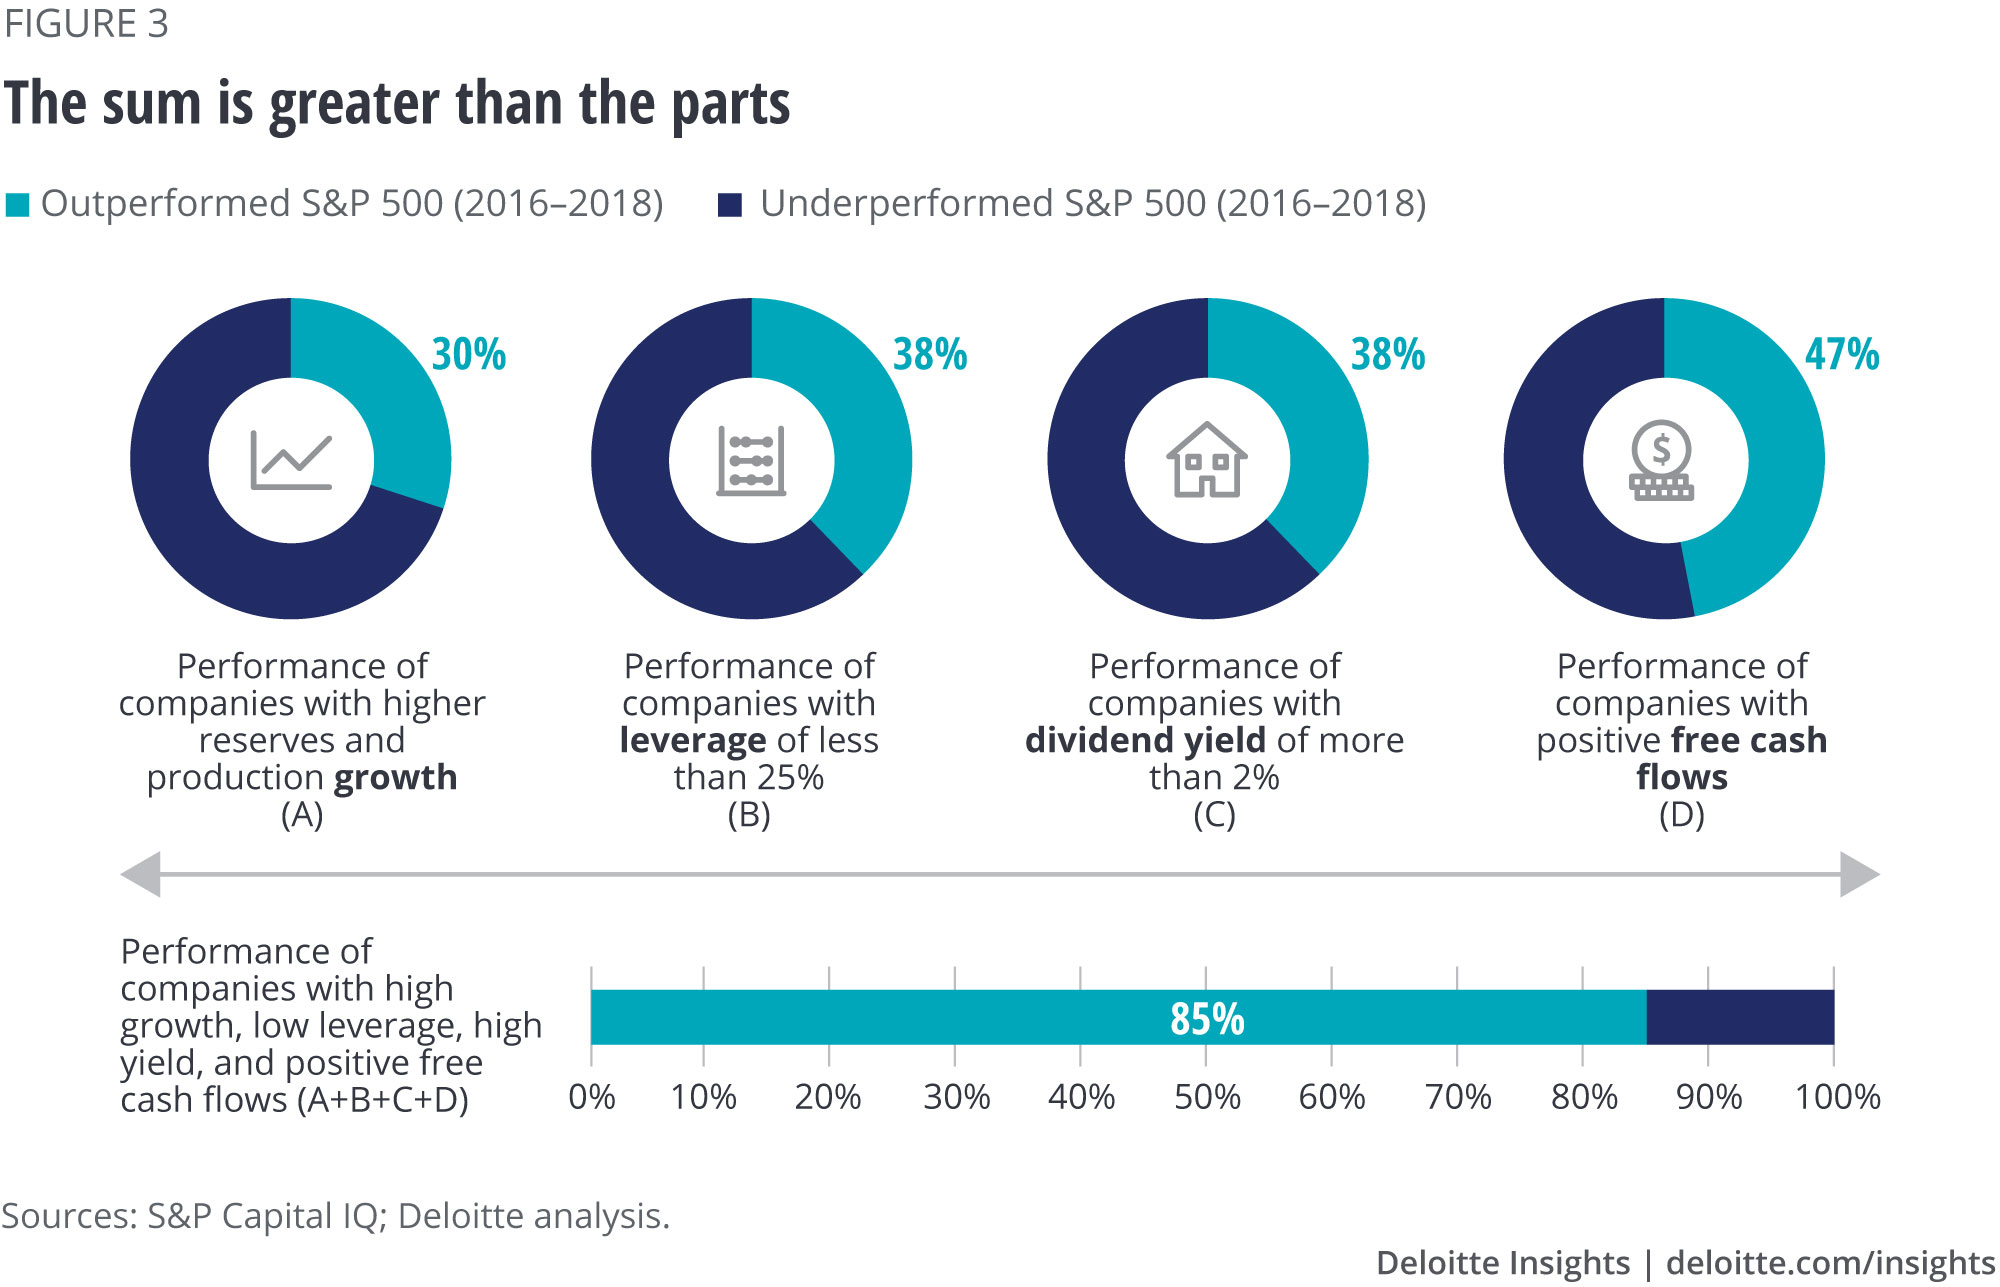
A fast-growing business—here, growth in O&G reserves and production—typically drives up the shareholder value of a company. However, our analysis of all listed pure-play and integrated oil companies worldwide suggests that less than 30 percent of high-growth upstream companies outperformed the broader S&P 500 index in an improved oil price environment over the past three years (figure 3).7 In today’s oversupplied market and short-cycled shale projects, it seems that the market is cautious on companies with an all-out growth model or companies with a growth-at-all-costs mindset.
But then again, upstream companies with conservative balance sheets also haven’t improved their valuations significantly. Only 38 percent of the listed upstream companies with a leverage ratio of less than 25 percent have outperformed the broader S&P 500 index since 2016.8 The result doesn’t minimize the importance of having a stronger balance sheet. But it appears to reiterate the importance of having the right balance of growth and flexibility and weakens the notion that the strongest balance sheets translate into the strongest portfolios.
Paying a growing dividend, along with measured buybacks regularly, have been central to the cash flow allocation strategy of many upstream companies, especially those with strong balance sheets. In fact, about one-third of the upstream companies worldwide in our sample set had a dividend yield of more than 2 percent (S&P 500 dividend yield) in 2018. But less than 40 percent of these high-yield upstream companies have outperformed the broader index, upending the primary objective of growing shareholder returns through these payouts.9 A similar problem of low stock prices despite high dividends is apparent in the US midstream segment, which is facing a capital conundrum (for more details, read our previously published paper, Back to basics: Solving the capital conundrum of midstream companies).10
Free cash flow, to a large degree, explains the challenge faced by many upstream companies in balancing their priorities around growth, profitability, capital investment, and shareholder returns. Only 25 percent of companies in our sample set reported positive free cash flows in the past three years, and about 47 percent of these consistent cash producers outperformed the broader index.11 Although a consistent free cash flow tends to have a stronger correlation with stock price movement, relative to other metrics, the market seems to be expecting a more complete balancing of books/priorities from upstream companies. And attaining this balance has never been tougher.
Thus, only a handful of companies have got closer to attaining the balance (i.e., growth without impacting leverage, payouts, and free cash flows) and most of them (about 85 percent) have outperformed the broader S&P 500.12 It is clear that the market wants to see healthy performance overall, driven by a future-ready portfolio from upstream companies. A future-ready portfolio is one that typically shields itself from probable price downsides, best sustains performance in a lower and volatile oil price environment, and scales up most quickly and efficiently when opportunity arises.13

Lessons from the downturn
Our bottom-up analysis of 32,000 global assets of leading O&G companies revealed the below characteristics and traits of companies with the strongest future-ready portfolios. Although each portfolio should be tailored to match each organization’s financial and operational capabilities and its strategic priorities, the following traits of most portfolio leaders can serve as guiding principles for other companies to consider when transforming their portfolio (for an in-depth analysis on these traits, read The portfolio predicament: How can upstream oil and gas companies build a fit-for-the-future portfolio?).
- Follow a consistent strategy and actively manage portfolio: Companies that follow a consistent strategy, either of concentration or diversification, but maintain a healthy pace of change and churn in their portfolio have consistently outperformed others. Being purposeful can be destructive, and doing nothing does not seem like an option anymore.
- Prioritize operational excellence over location: Companies that prioritize “how” before the “where” or capitalize on their strengths over just acquiring acreages in trending rocks and basins often have a higher probability of delivering profitable growth across price decks.
- Manage resources by focusing on investment cycles: Outperformers typically optimize their resource portfolio using the lens of cash and capital cycles, rather than treating investment cycles as an afterthought. In fact, building investment flexibility in a portfolio has potentially never been more important.
- Attain a balanced fuel mix: Many performers closely follow the changing demand patterns in both the fuels and strive for a fairly stable oil–gas mix, where their exposure to natural gas is important but not central yet to their success.
A comprehensive high-grading of the entire portfolio, as against a piecemeal situational adjustment, and a consistent communication of progress against this strategy to the market, could overcome the systemic underperformance experienced by the segment. Considering upstream is just one part of the changing O&G ecosystem, upstream strategists could benefit from gaining perspectives across the O&G value chain. Explore the entire Decoding the O&G downturn series to gain a 360-degree view of the industry.
More insights for Oil, Gas & Chemicals
-
Oil & Gas Collection
-
From bytes to barrels Article7 years ago
-
Refining at risk Article6 years ago
-
Following the capital trail in oil and gas Article9 years ago
-
A renaissance in the domestic oil and gas industry Article11 years ago
-
Global renewable energy trends Article6 years ago


