
![[bold-start]Figure 2. Services is leading the recovery in consumer spending since Q2 2021[bold-end]Sources: United States Bureau of Economic Analysis (sourced using Haver Analytics); Deloitte economics analysis.](/us/en/insights/economy/spotlight/consumer-spending-inflation-services/_jcr_content/root/responsivegrid_380572564/advanced_image0.coreimg.95.800.jpeg/1685427339379/us175516-figure2.jpeg)
![[bold-start]Figure 3. With inflation edging lower since June 2022, real earnings have gone up by 1.1%[bold-end]Sources: United States Bureau of Labor Statistics (sourced using Haver Analytics); Deloitte economics analysis.](/us/en/insights/economy/spotlight/consumer-spending-inflation-services/_jcr_content/root/responsivegrid_380572564/advanced_image1.coreimg.95.800.jpeg/1685427339394/us175516-figure3.jpeg)
![[bold-start]Figure 4. Borrowing costs have shot up for both consumers and businesses[bold-end]Sources: Haver Analytics; Deloitte economics analysis.](/us/en/insights/economy/spotlight/consumer-spending-inflation-services/_jcr_content/root/responsivegrid_380572564/advanced_image2.coreimg.95.800.jpeg/1685427339407/us175516-figure4.jpeg)
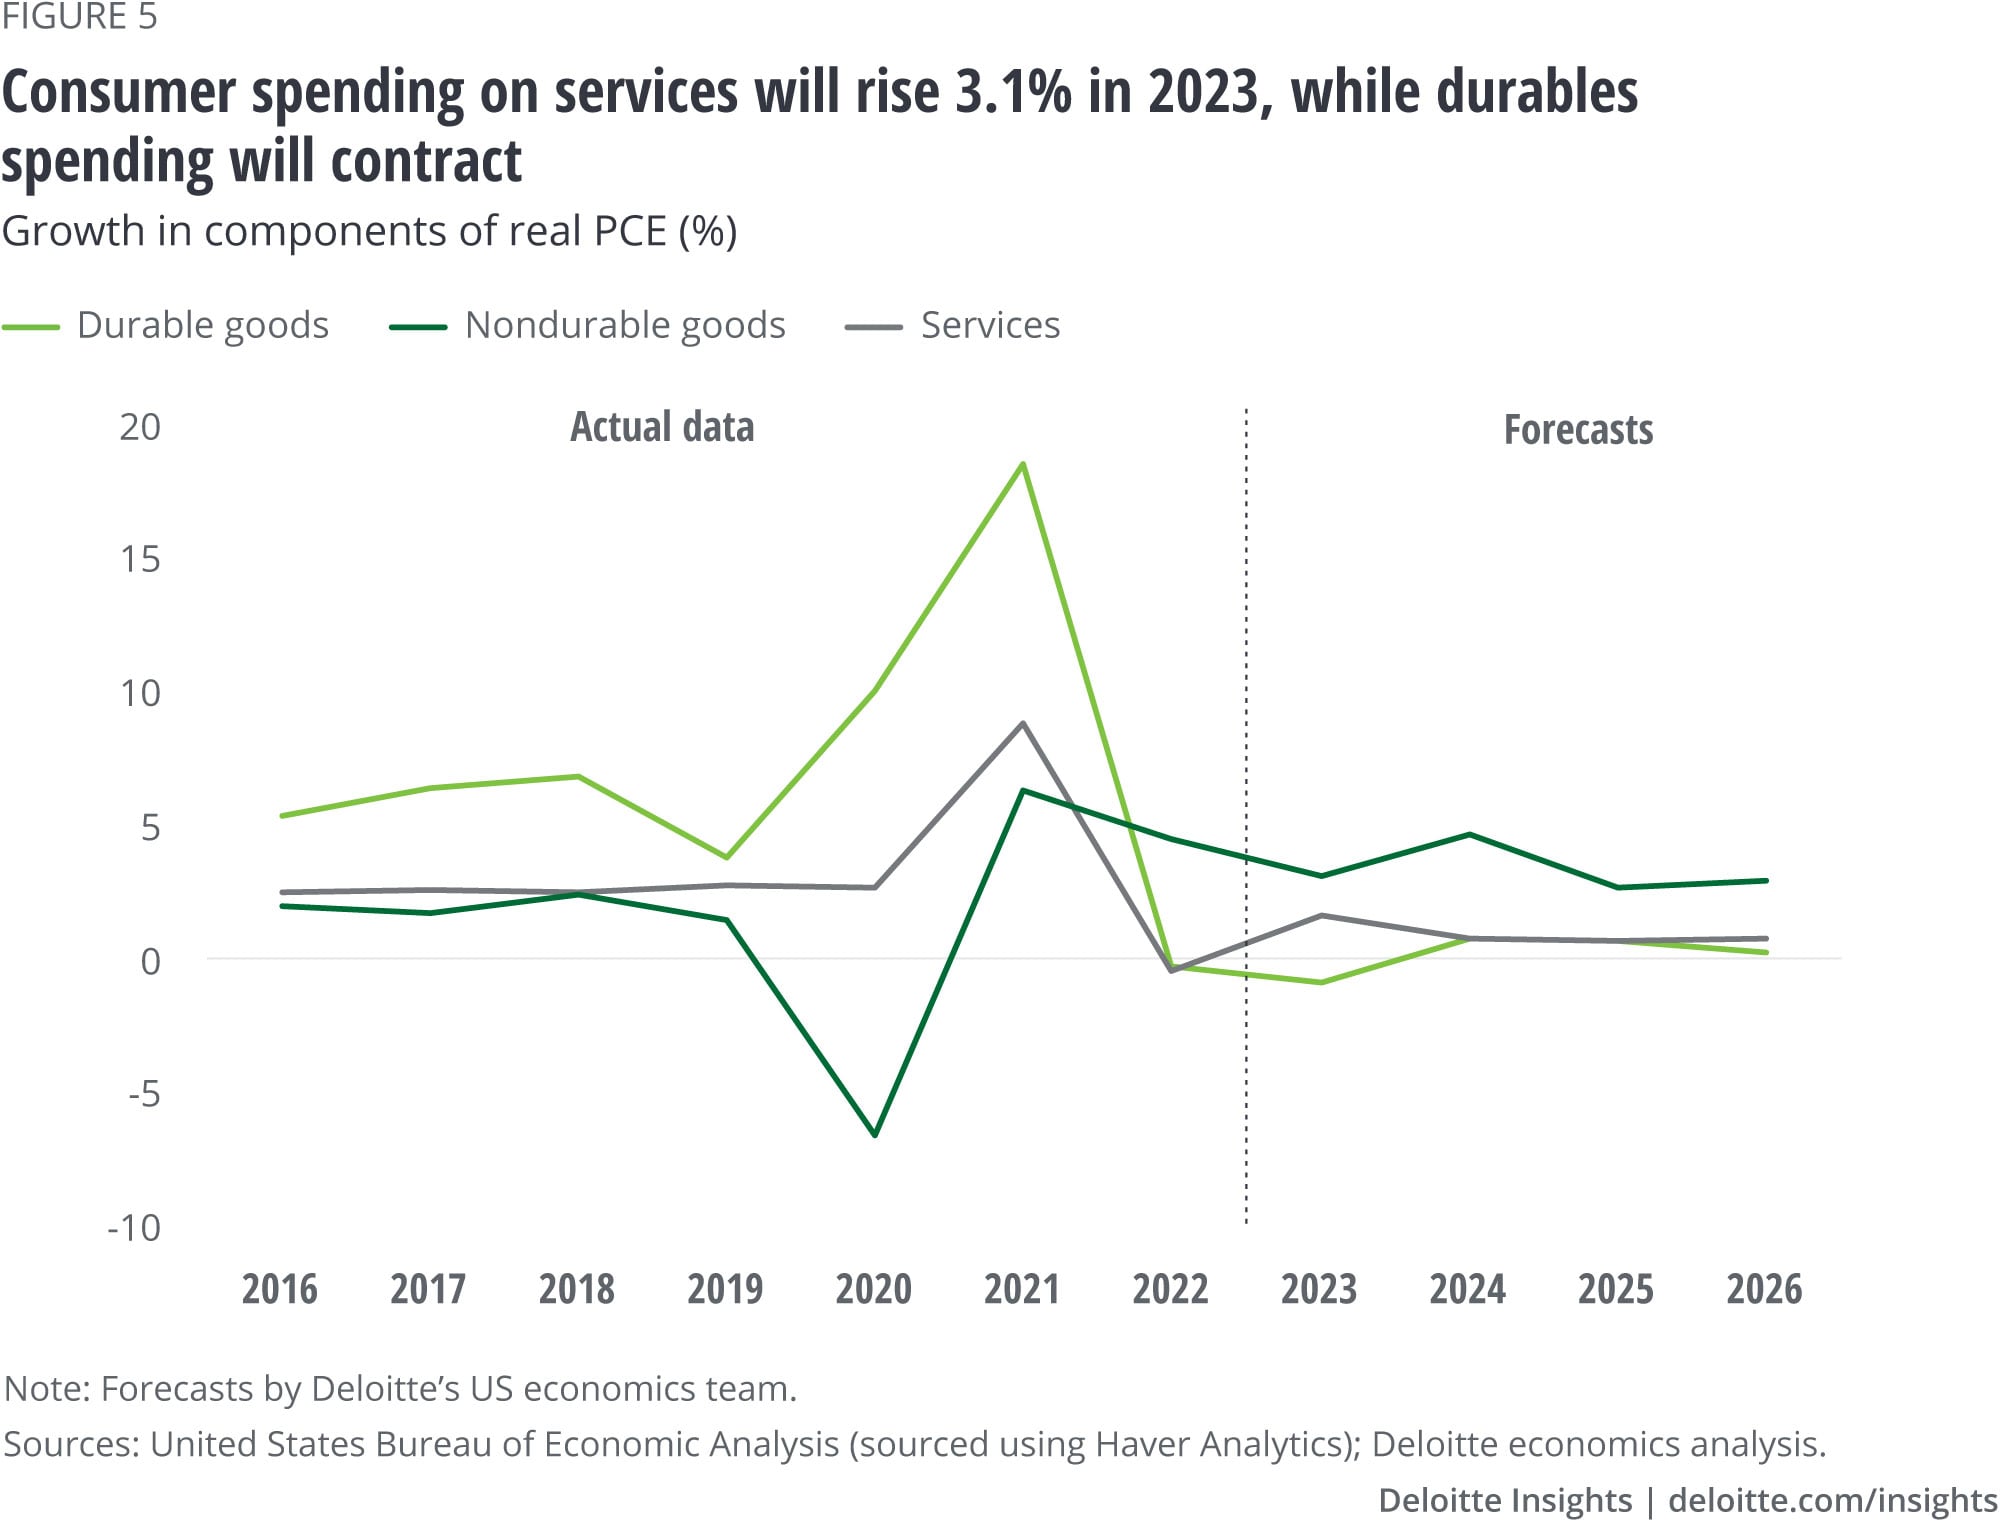
![[bold-start]Figure 5. Consumer spending on services will rise 3.1% this year while durables spending will contract[bold-end]Note: Forecasts by Deloitte’s US Economics Team.Sources: United States Bureau of Economic Analysis (sourced using Haver Analytics); Deloitte economics analysis.](/us/en/insights/economy/spotlight/consumer-spending-inflation-services/_jcr_content/root/responsivegrid_380572564/advanced_image3.coreimg.95.800.jpeg/1685427339423/us175516-figure5.jpeg)


Tailwinds favor consumer spending on services has been saved
The author would like to thank Patricia Buckley and Daniel Bachman, US Economics, and Steve Rogers, Consumer Industry Center, for their reviews and suggestions.
Cover image by: Sofia Sergi

It’s confusing to be a consumer in the United States these days: Just as inflation clouds slowly clear, strong headwinds to economic growth have emerged on the horizon. High borrowing cost is leading to banking strains and weighing on economic growth. If such economic risks rise, the labor market will also be affected, forcing consumers to save more and spend less. That may just be enough to tip the economy into recession, as consumer spending accounts for more than two-thirds of GDP.1 This trend has played out in most recessions in the United States, with goods spending usually suffering more than services spending. In the recession of 2007–2009, for example, real personal consumption expenditure (PCE)2 fell 2.3%, with durable goods spending declining 14.5% from peak to trough.3
So, how will consumer spending pan out this year and the next? Economic and financial conditions will shape spending through their impact on consumer sentiment and purchasing power. The nature of the previous recession will also play a part. The downturn of 2020 was unique as, unlike previous recessions, it was due to a public health emergency. COVID-19 forced deep changes in how people live, work, and spend. And with avenues limited, spending on services gave way to spending on goods, especially durables. Since mid-2021, however, that trend has been reversing. And this will continue over the next few years.
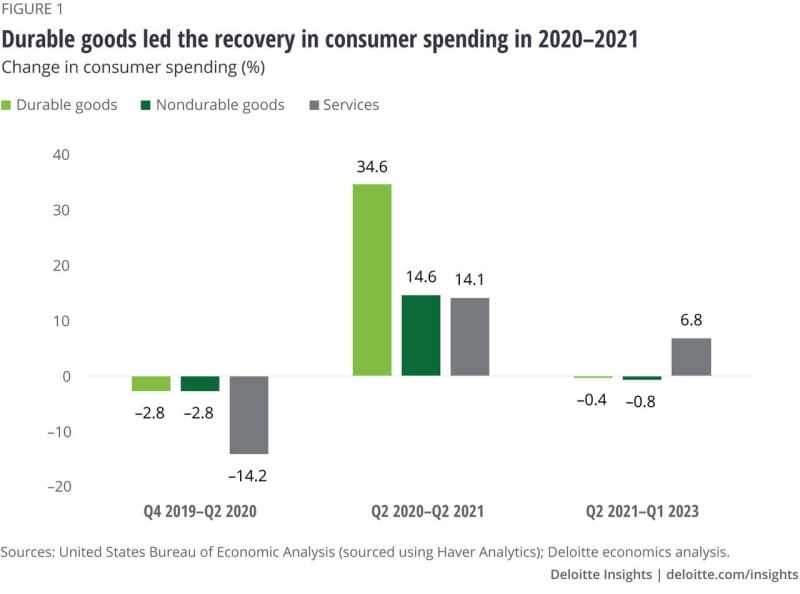
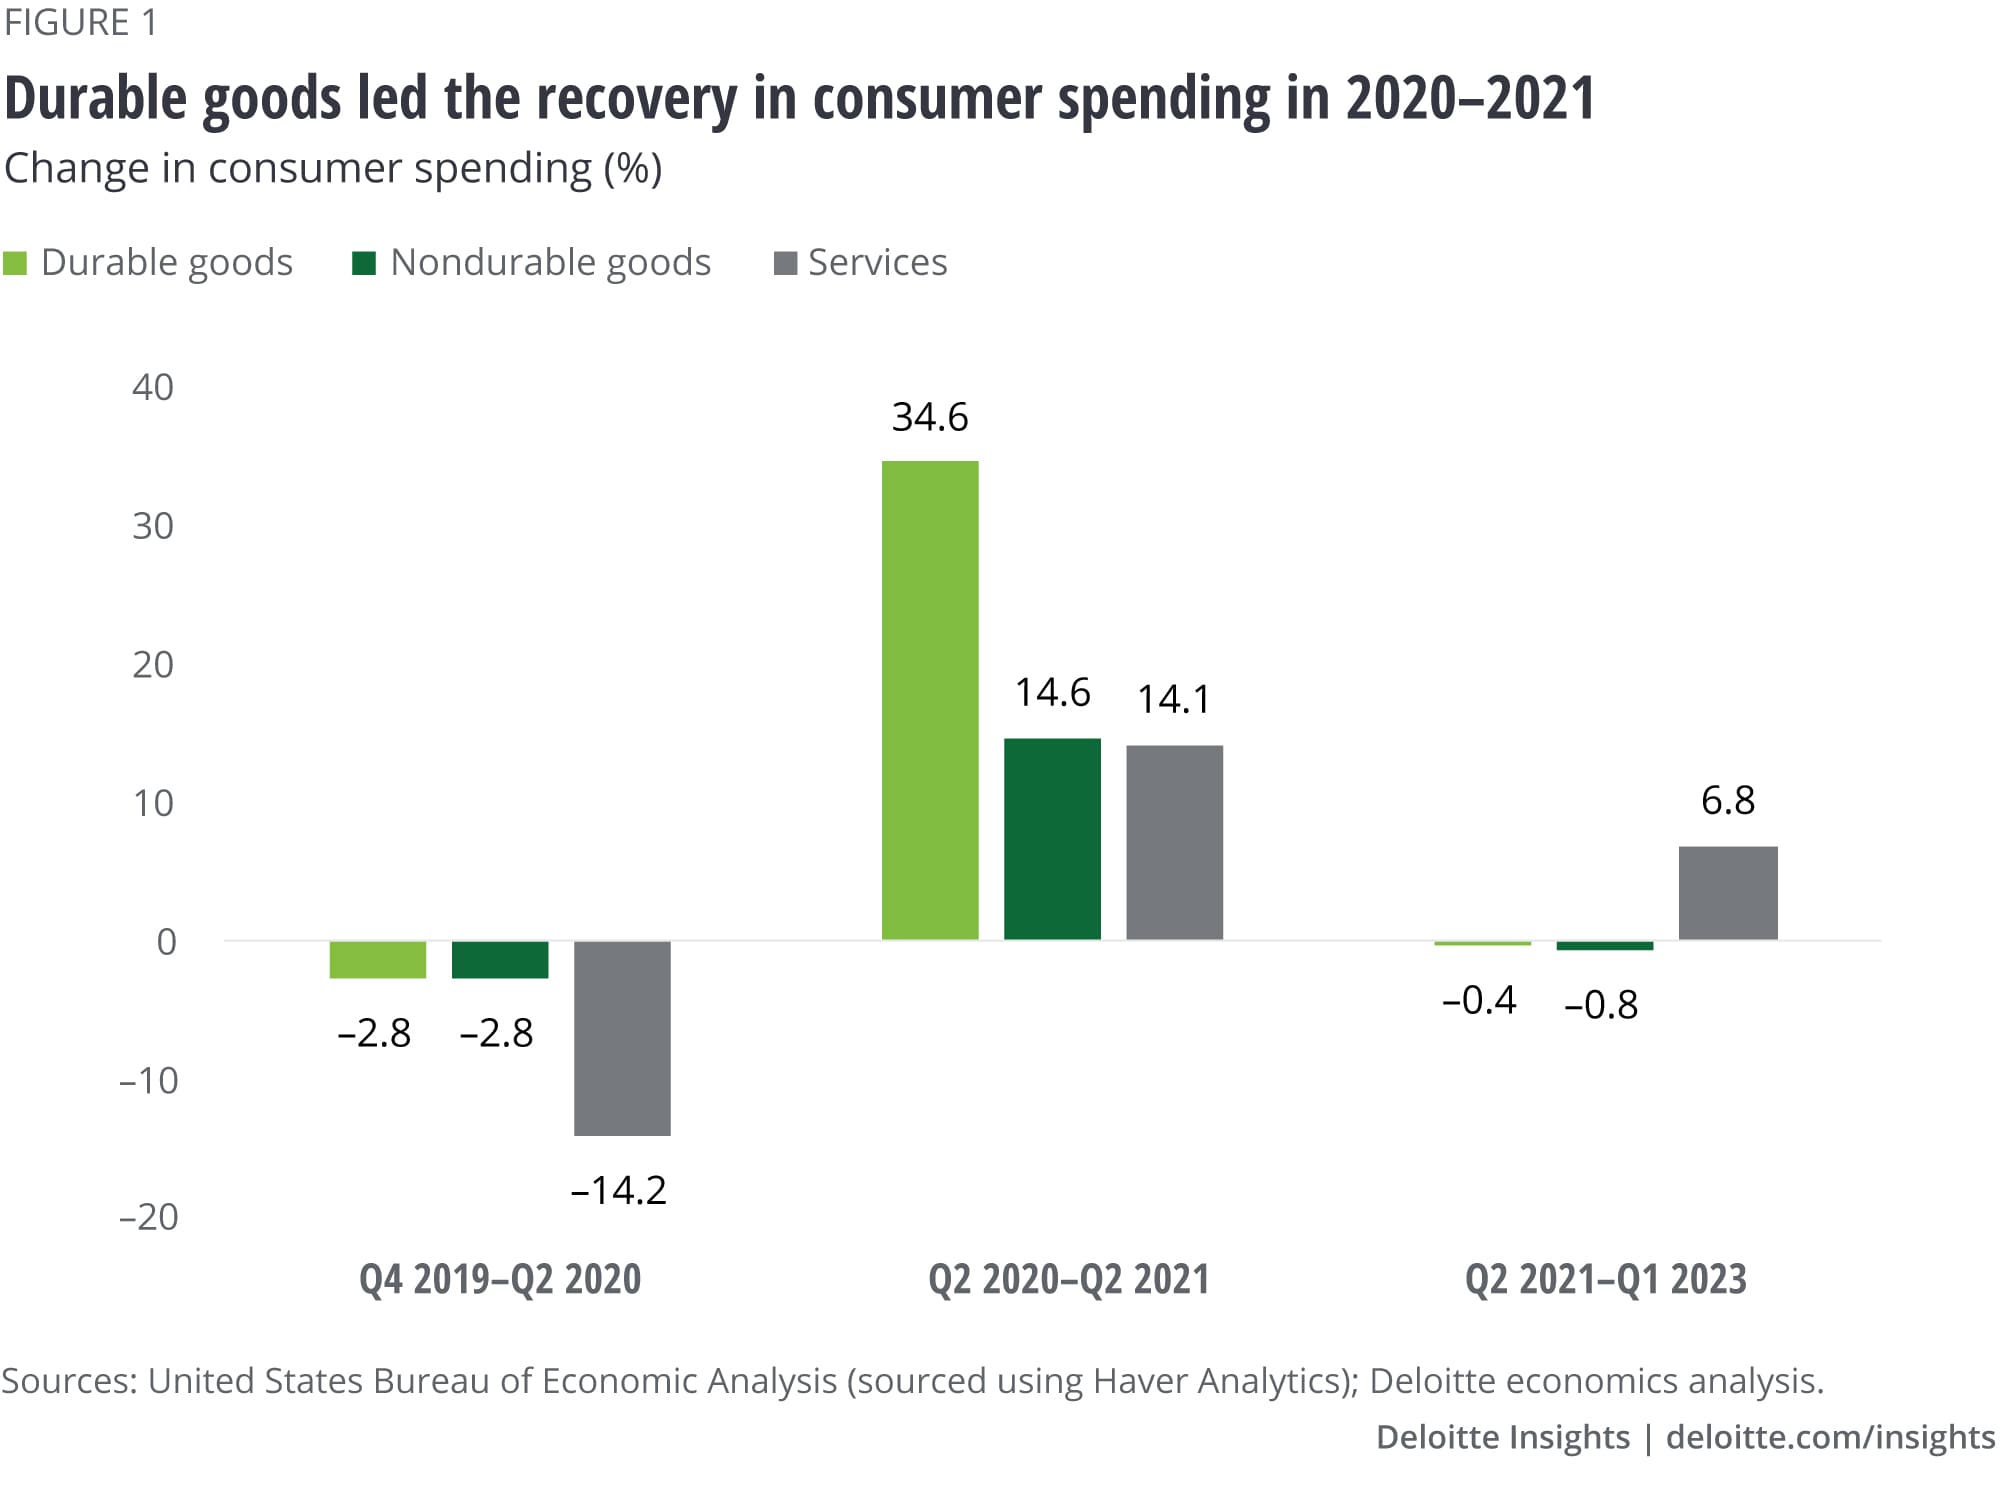
During recessions, spending on goods typically suffers more than that on services. The pandemic-induced recession of 2020 was, however, different. Spending on contact-intensive services fell sharply due to social distancing, a shift to remote work, and fears of the virus. Between Q4 2019 and Q2 2020—the period of the last recession—PCE on recreation services fell 42.7%, with food services, accommodation, and transportation also suffering deep contractions. Overall, consumer spending on services fell 14.2% during the recession, a degree of contraction almost unheard of in the post-World War II era.
What happened to spending on durable goods? Well, household savings rose sharply as people hunkered down in their homes and stayed away from gyms, restaurants, and vacations. The personal saving rate jumped to 33.8% in April 2020 from 9.3% in February.4 With so much savings at hand and very few services to spend on, consumers suddenly changed tactics. They set up home gyms and personal workstations and sought out the latest recreation gadgets. PCE on goods, therefore, contracted just 2.8% in the recession of 2020, a far smaller decline than services (figure 1).
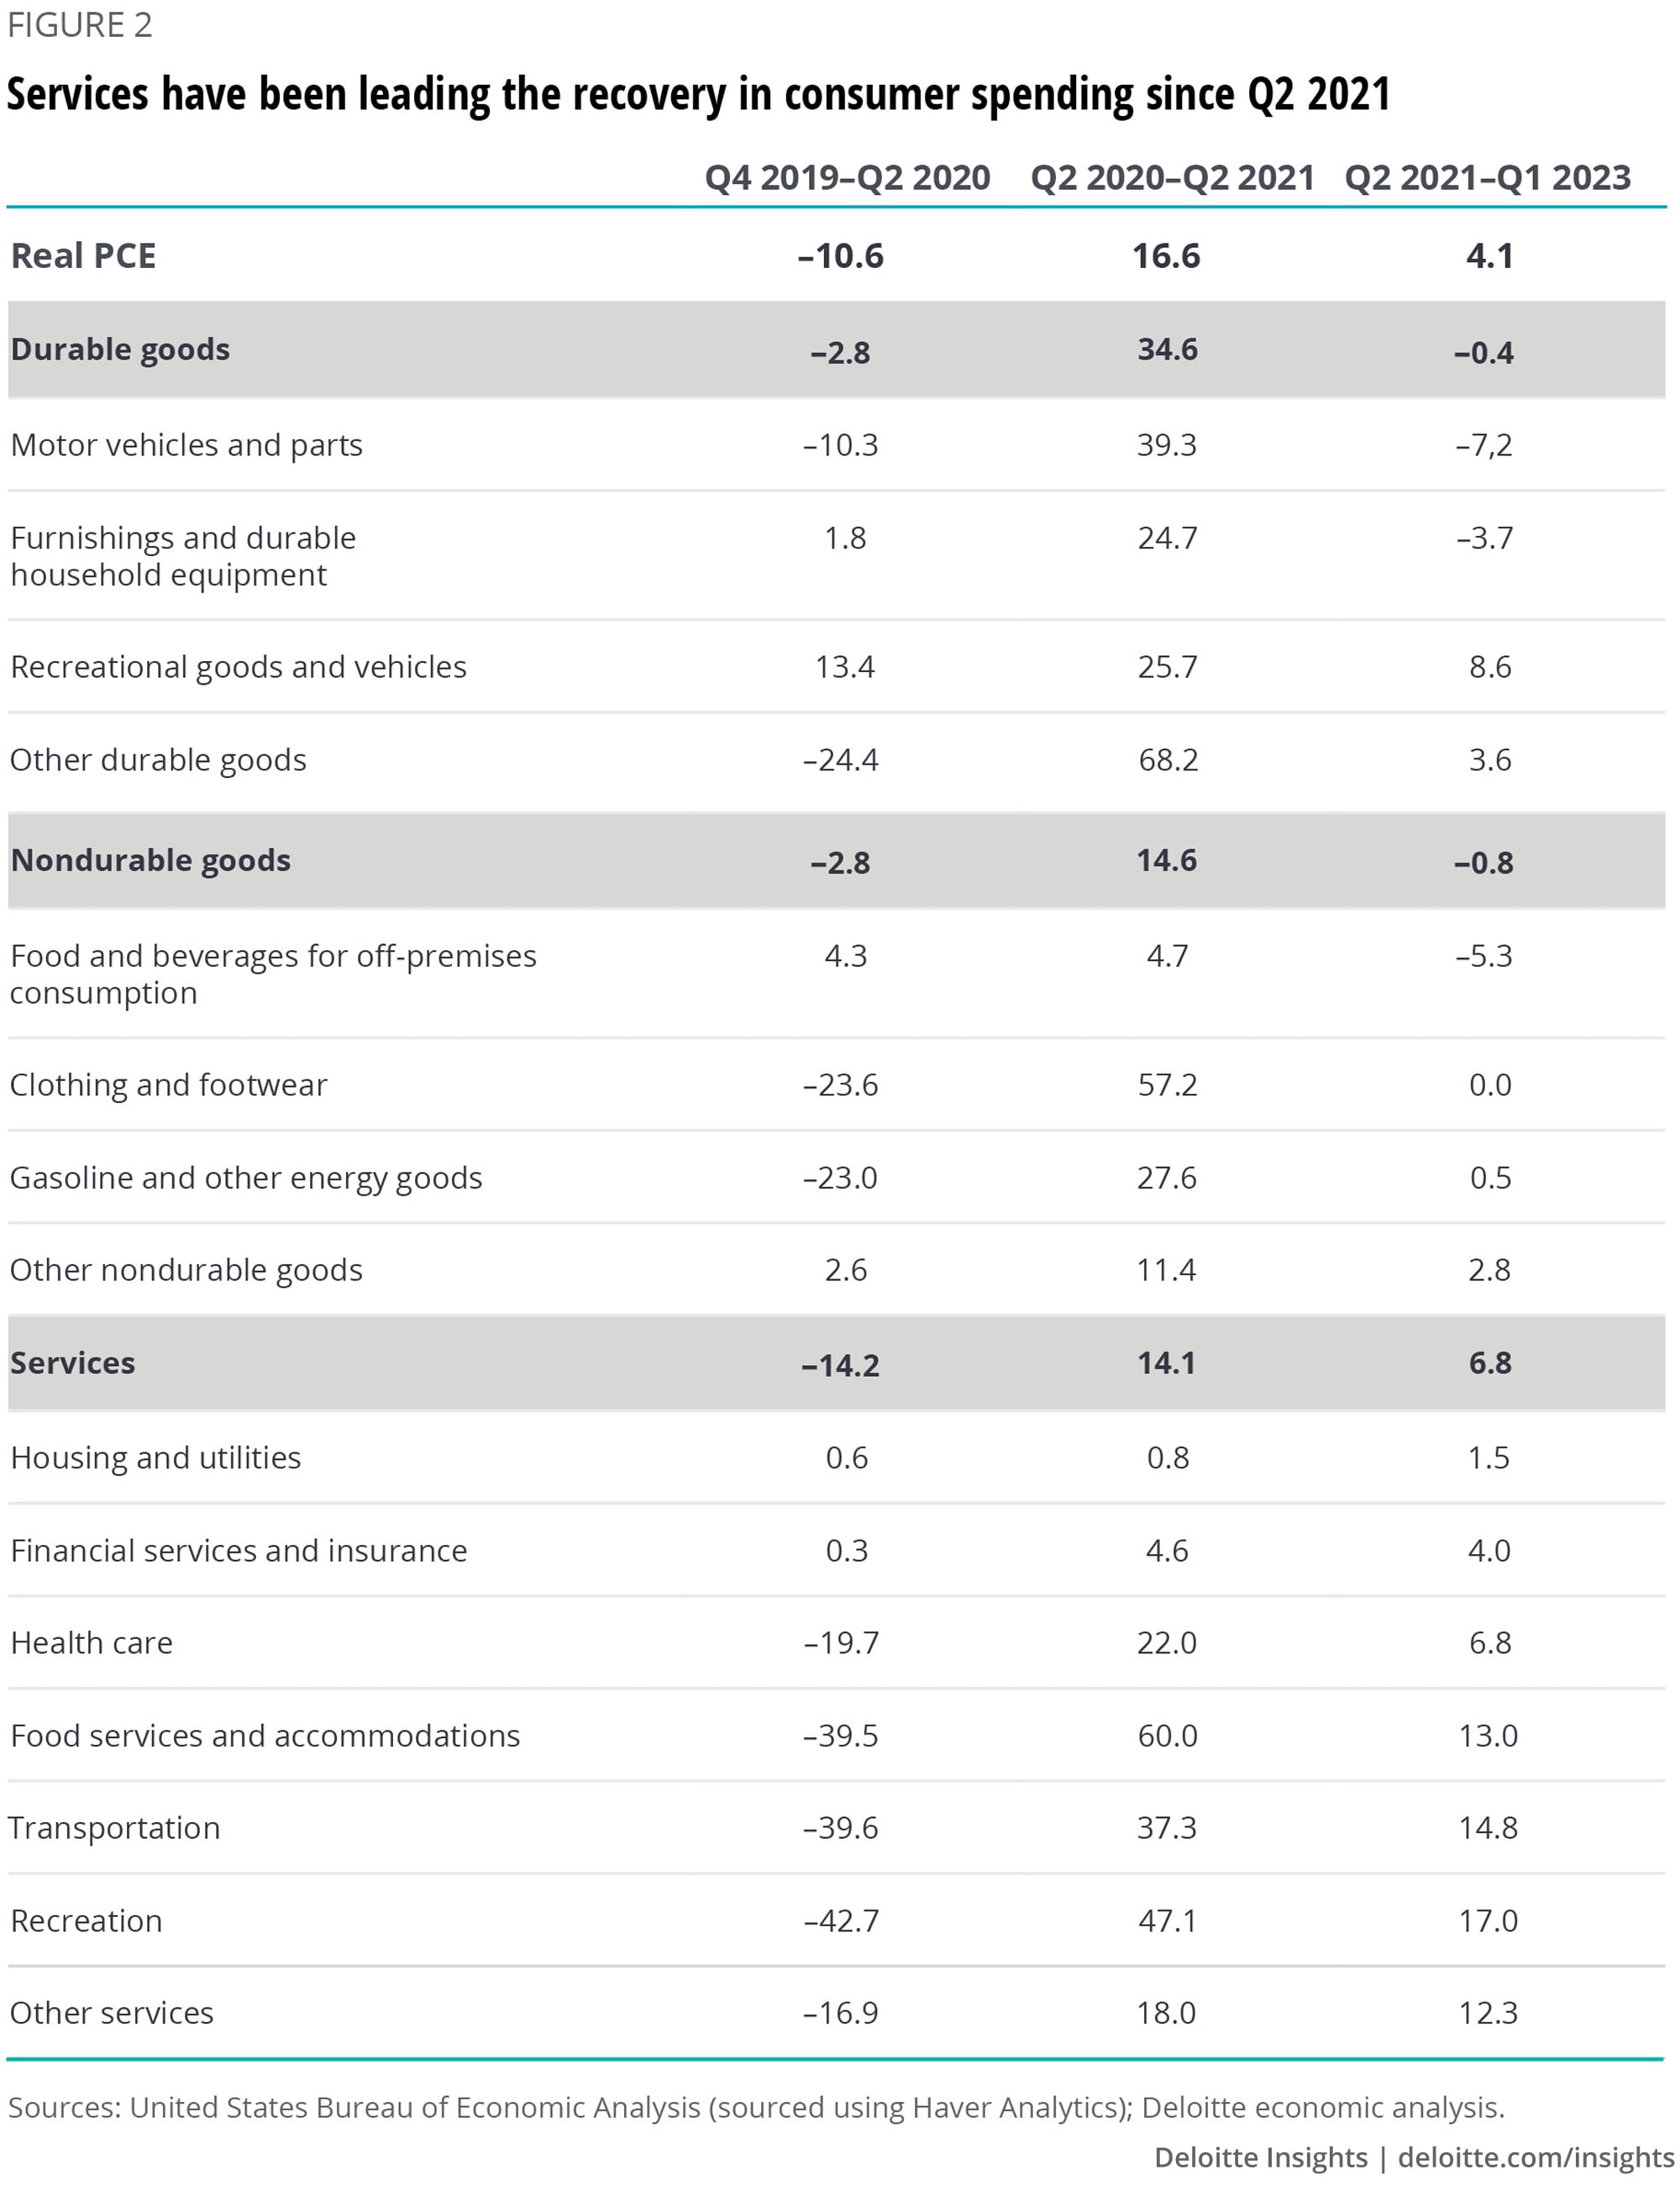
This shift to goods from services intensified into the economic recovery until mid-2021. By Q2 2021, PCE on durable goods was up 34.6% compared to the trough of the previous recession, much higher than the 14.1% rise in services. After that, however, rising vaccinations across the country assuaged health-related concerns, and people slowly started returning to prepandemic ways of spending. Figure 2 shows that, since Q2 2021, services have been the key driver of consumer spending. PCE on food services and accommodation, transportation, and recreation are recovering steadily. Consumers are also dipping into savings to spend on services they missed out on during the pandemic.
Consumer spending on durable goods, however, has slowed—it fell 0.4% from Q2 2021 to Q1 2023. Unlike vacations or baseball games, there’s a limit to the amount of durable goods someone can buy. Replacing your car or furniture every year hardly makes sense. In fact, spending on motor vehicles and parts, and furnishings and durable household equipment fell the most during this period (figure 2). PCE on nondurable goods has also suffered of late. Purchases of food and beverages have declined 5.3% since Q2 2021. This reflects a return to ways of food consumption prior to the pandemic, with some home cooking giving way to eating out at restaurants.
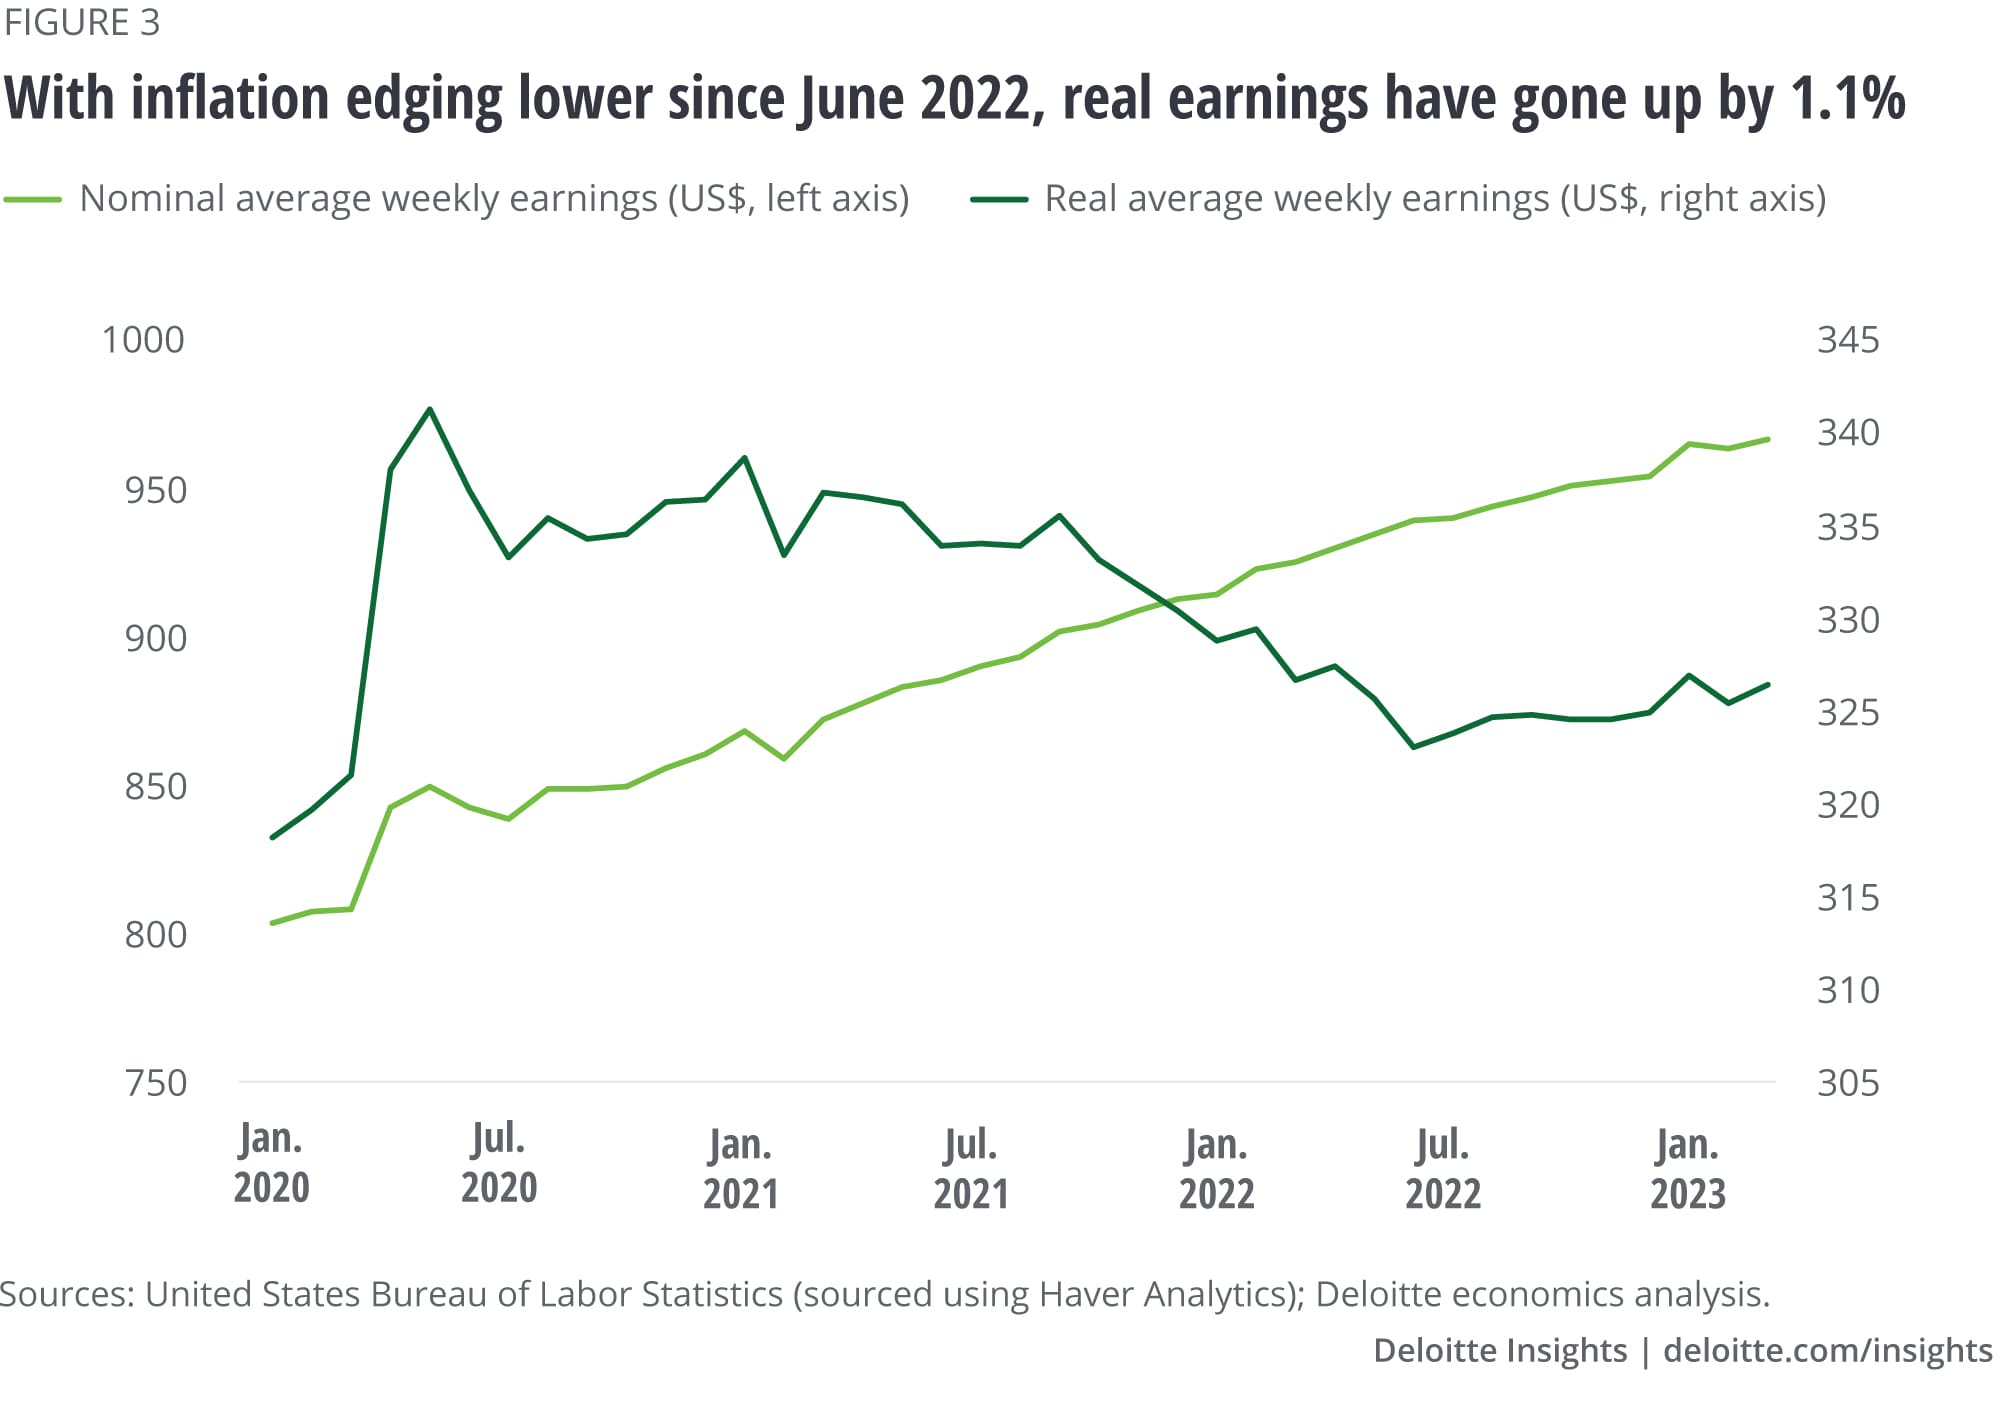
Consumers will benefit from a decline in inflation in recent months.5 Goods inflation has fallen to 1.6% in March 2023 from 10.6% in June 2022 as supply chain bottlenecks ease and consumer demand shifts to services. Energy prices, which had soared after Russia’s invasion of Ukraine, have also retreated from their peaks. Services inflation, however, remains high due to rising consumer demand (versus goods inflation). As price pressures ease, consumers’ purchasing power will rise. Since June last year, real weekly earnings have gone up 1.1%.6 Contrast this to the first six months of 2022 when real earnings fell 2.2% (due to high inflation), despite a 2.9% rise in nominal earnings (figure 3). As inflation eases, consumer sentiment appears to be shifting. This is evident from a slow improvement in the University of Michigan’s index of consumer sentiment, a measure that puts much emphasis on inflation.7
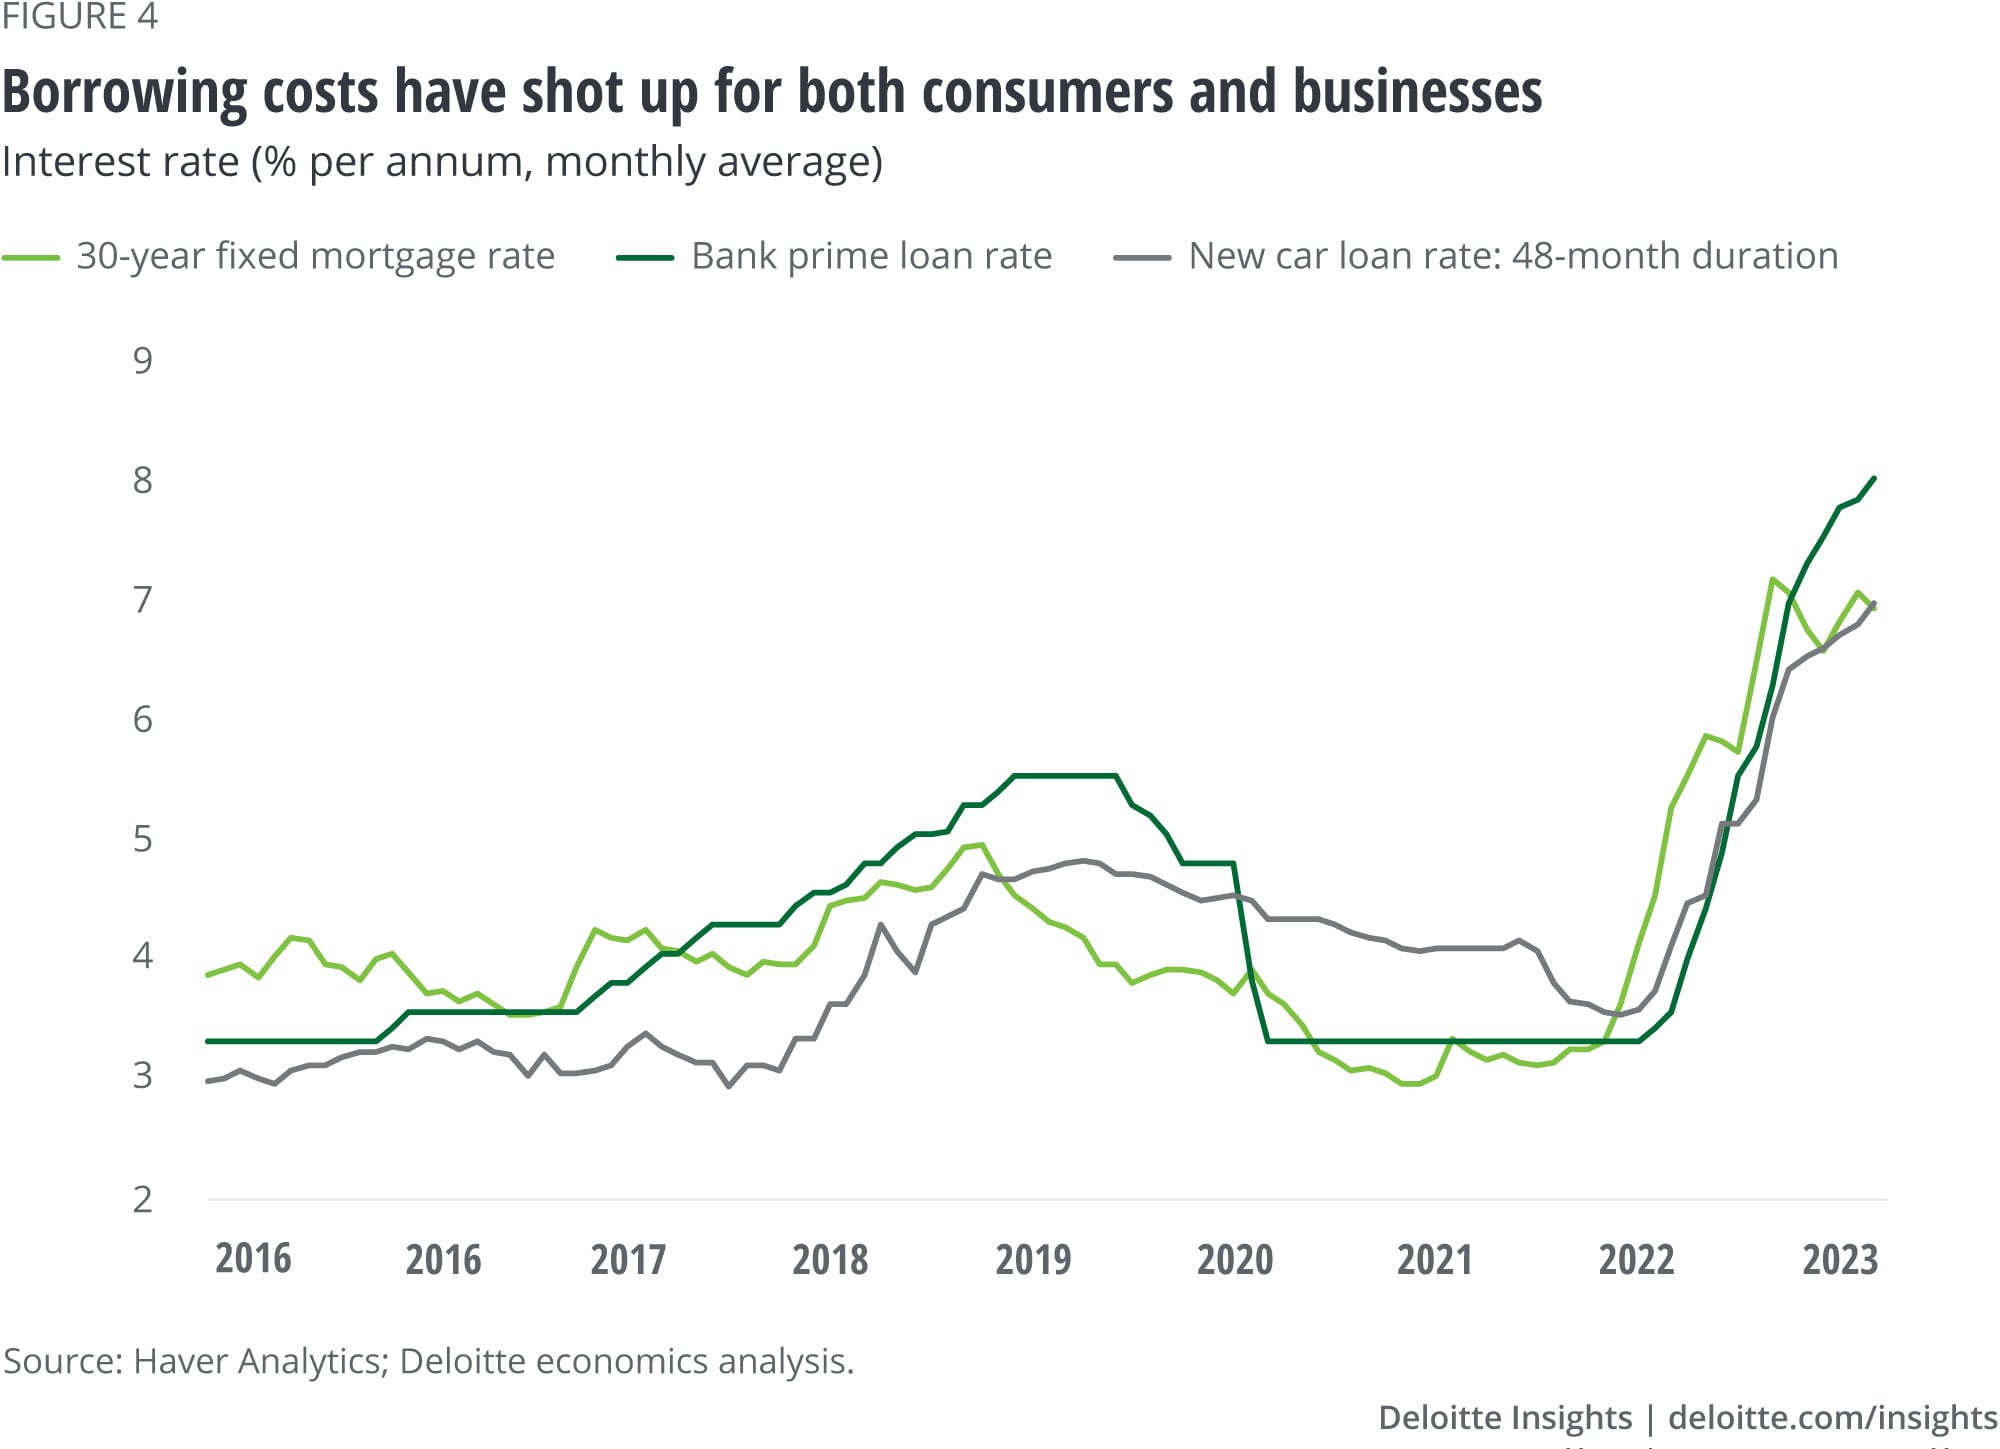
What caused price pressures to decline may end up denting the economy. The Federal Reserve (Fed) has raised its policy rate by 500 basis points (bps) since March 2022 to tame inflation. The scale and speed of this tightening are far more intensive than the previous bout of Fed between December 2015 and December 2018. As a result, borrowing costs have shot up since 2022 (figure 4), denting key sectors in the economy. In housing, starts are down 21.3% since their peak in March 2022.8 Banking has also been affected as a hit to the mark-to-market values of certain assets due to rising interest rates has led to the loss of depositor and investor confidence. If such risks intensify, they will weaken GDP growth sharply, if not tip the economy into recession.9 And that’s not good news for the labor market. While the labor market still seems healthy, recent data releases point to some easing. For example, job gains have eased over the past year in sectors such as manufacturing and information.10 Also, some of the overall payroll increases in recent months have been revised down.11 In its May release, the Bureau of Labor Statistics noted that payroll increases were 149,000 less for February and March (combined) than previously reported.12 A weaker labor market, in turn, will impact wage gains and consumer sentiment, thereby hitting consumer spending.
Finally, the imbalances in consumer spending due to the pandemic will ease over the next few years. The ratio of PCE on services to disposable personal income (DPI) fell to 49.7% in 2020 from 56.5% the year before, as consumer spending on services fell and savings increased during the pandemic. In contrast, the ratio of spending on durable goods to DPI shot up over 2020 to 2022. Now that consumers are already sitting on large purchases of durables and as fears of COVID-19 fade, spending on durable goods will decline even as services continue to benefit. This shift is already underway (since mid-2021) and will continue until the ratio of PCE for different spending categories to DPI reverses back to their prepandemic averages.
Given these headwinds and tailwinds, we expect overall consumer spending growth to slow to 1.9% in 2023 from 2.8% in 2022; growth is expected to remain almost the same next year.13 Much of this growth will be due to services—we forecast PCE on services to rise 3.1% this year and 4.7% in 2024. In contrast, spending on durable goods will decline this year before recovering slowly over the next few years (figure 5). Also, weighing on near-term spending on durables, such as automobiles, is the high cost of borrowing. Similarly, a downturn in housing could indirectly impact consumer purchases of goods such as furnishings and durable household equipment.
There are, however, downside risks to these forecasts. Deteriorating economic and financial conditions such as a banking sector crisis or a delayed resolution of the federal debt ceiling may dent the confidence of consumers and businesses alike and lead to a recession in 2023–2024.14 In such a scenario, consumers will hold back. PCE on services will then end up lower than expected in 2023, while contraction in durable goods will be higher.

