
Slow growth in wages: Is the reason occupational shifts? Issues by the Numbers, April 2020
14 minute read
04 April 2020
While higher job losses in low-paid occupations during the recession resulted in stronger real wage growth, a partial reversal of this trend is somewhat responsible for the slow growth of real wages in this recovery.
The labor market in the United States continued to show strength up until the apparent end of the expansion in March due to efforts to contain the spread of COVID-19. Yet for all the job gains and low unemployment—it was a mere 3.5 percent in February 2020—wages haven’t risen by much.1 While employment has gone up by 15 percent since the trough in December 2009, wage gains have been much lower. Real average hourly earnings—nominal values adjusted for inflation—have gone up by only 6.8 percent in this period.2 And even the current tightness in the labor market was not able to push wages up toward a higher growth trajectory.
Learn more
View the related infographic
Explore the Issues by the Numbers collection
Learn about Deloitte’s services
Go straight to smart. Get the Deloitte Insights app
What explains this slow pace of real wage growth amid such a tight labor market during the current economic expansion? Our analysis of occupations data (see sidebar, “Data brief and methodology”) from the Bureau of Labor Statistics (BLS) reveals that part of the explanation lies in the shifting occupational mix of employment. During 2007-2010, a period that covers the Great Recession, relatively more job losses among lower-paid occupations as compared to higher-paid ones resulted in relatively strong average wage growth. A partial reversal of this trend since then accounts for some of the sluggishness in wages in the recent expansion.
Data brief and methodology
For our analysis, we used data from the Occupational Employment Statistics (OES) by BLS.3 In OES, annual data on employment and mean nominal wages is available for 22 major occupations (and key suboccupations) from 1999 to 2018. Data prior to 1999 uses a different classification for occupations and, hence, is not comparable. To keep the analysis relevant to the discussion in this paper, we took data from 2002 onward. This included the economic expansion of 2002–2007, a period that includes the Great Recession (2007–2010), and the recent recovery starting 2010.
Analysis of employment and wage trends based on occupations is a departure from the usual way of looking at these variables, through the lens of industries. People in a given occupation can work for a variety of industries. For example, those in management occupations can be found in most, if not all, industries, with the largest number working in construction industries (8 percent), followed by restaurants and food services (7 percent), and banking and related industries (4 percent). Even in an occupation such as food preparation and serving, where restaurants and food service industries account for a major share of employment (76 percent), the remaining 24 percent is spread among industries as diverse as elementary and secondary schools (4 percent), and supermarkets and grocery stores (3 percent).4
Given that our focus was to observe trends in real wages, we deflated the nominal numbers to real ones using the consumer price index for all urban consumers,5 keeping 2002 as the base year. In short, all figures for mean real wages were priced in 2002 dollars using our methodology.6 And to understand the level of wages existing currently, we used nominal wages.
Growth in employment and real wages higher in the recent expansion than in the previous one
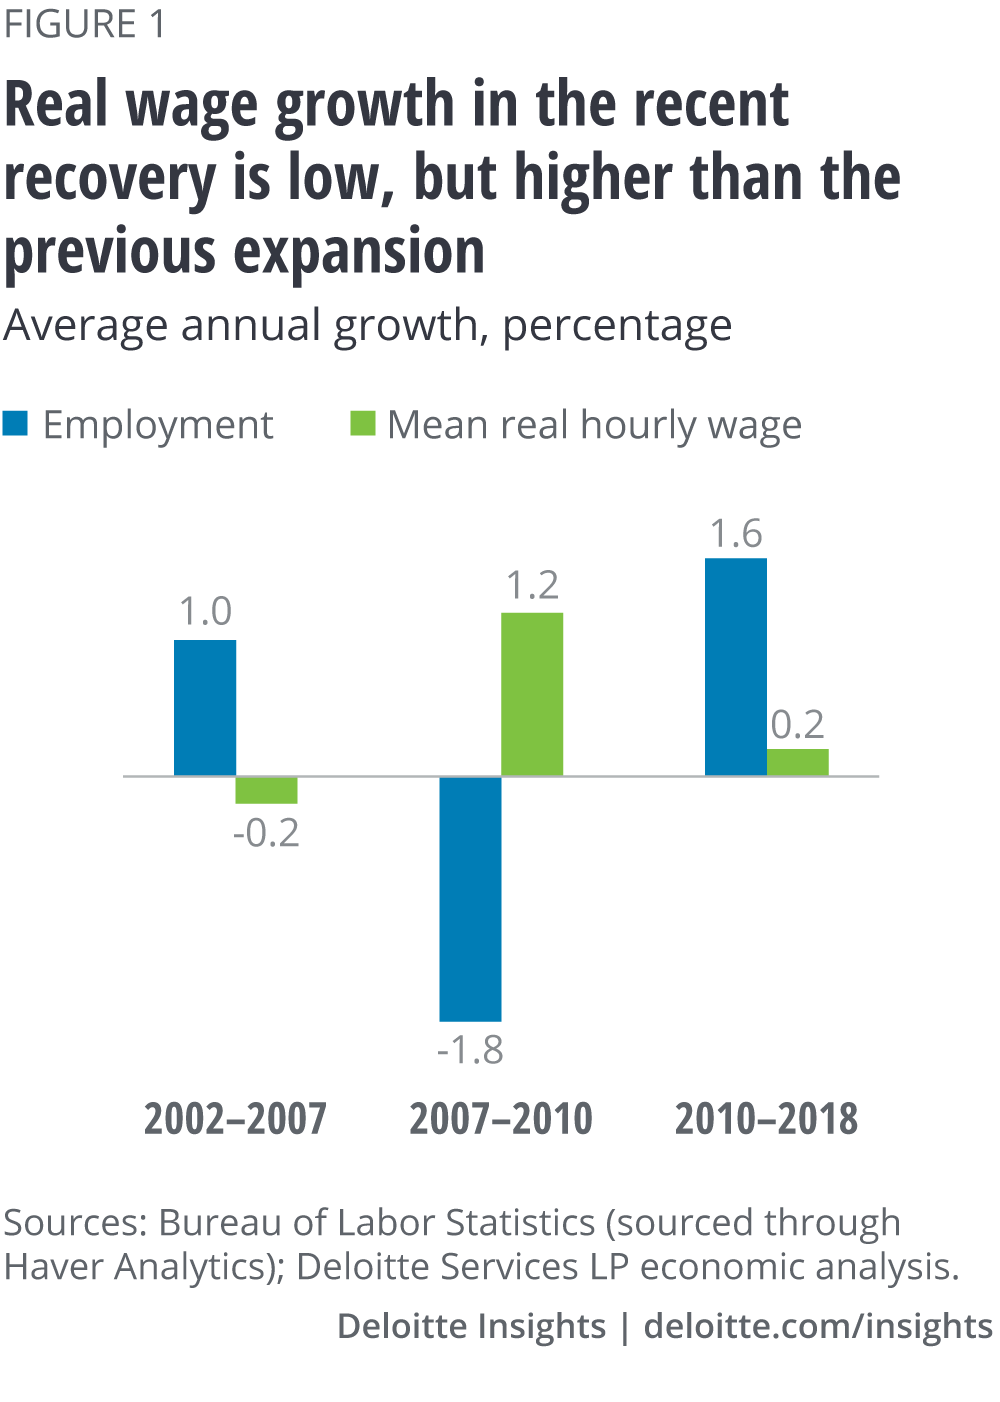
Analysis of OES data reveals that between 2010 and 2018, employment in all occupations grew at an average annual rate7 of 1.6 percent, higher than the 1 percent corresponding rise in the previous expansion (2002–2007). Contributing to the strong rise in employment during the current economic expansion is the reabsorption of large numbers of people who were left unemployed due to the Great Recession. Between 2007 and 2010, employment fell by 1.8 percent on average per year.
Even with strong job growth, however, real wages haven’t increased by much in the recent expansion. Since 2010, the mean real hourly wage8 increased by just 0.2 percent per year on average till 2018. Yet, as figure 1 shows, this pace of increase in real wages is still better than the 0.2 percent contraction during the expansion of 2002–2007. The net result of either negative or low growth in these two expansions has been that real wages haven’t grown by much on average since 2002, despite gains during the recession (figure 1). The mean real wage in 2018 (see sidebar) was just 4.7 percent higher than the corresponding figure nearly 16 years ago—hardly much to show in terms of rising purchasing power.
A tale of diverging trends in employment and wages
During the recent expansion, only six occupations out of 22 recorded real wage growth faster than the national average (figure 2).9 Mean real wages grew the fastest between 2010 and 2018 for farming, fishing, and forestry occupations (0.9 percent on average per year), followed by food preparation and serving-related occupations (0.6 percent), and health care support occupations (0.6 percent). Also, the occupations that posted the fastest rise in real wages during the recent recovery are not the same as those that witnessed strong real wage growth in the previous recovery. Mean real wages for farming, fishing, and forestry occupations, for example, contracted between 2002 and 2007, contrary to strong growth in 2010–2018.
Figure 2 also shows that, just as in 2010–2018, mean real wages grew faster than the national average in six occupations between 2007 and 2010. But this is where the similarity ends. In 2007–2010, only three occupations experienced a decline in mean real wage compared to nine in 2010–2018. And a comparison of growth rates in both periods for each occupation reveals that in only two occupations, mean real wages grew faster in the recent expansion than in 2007–2010.
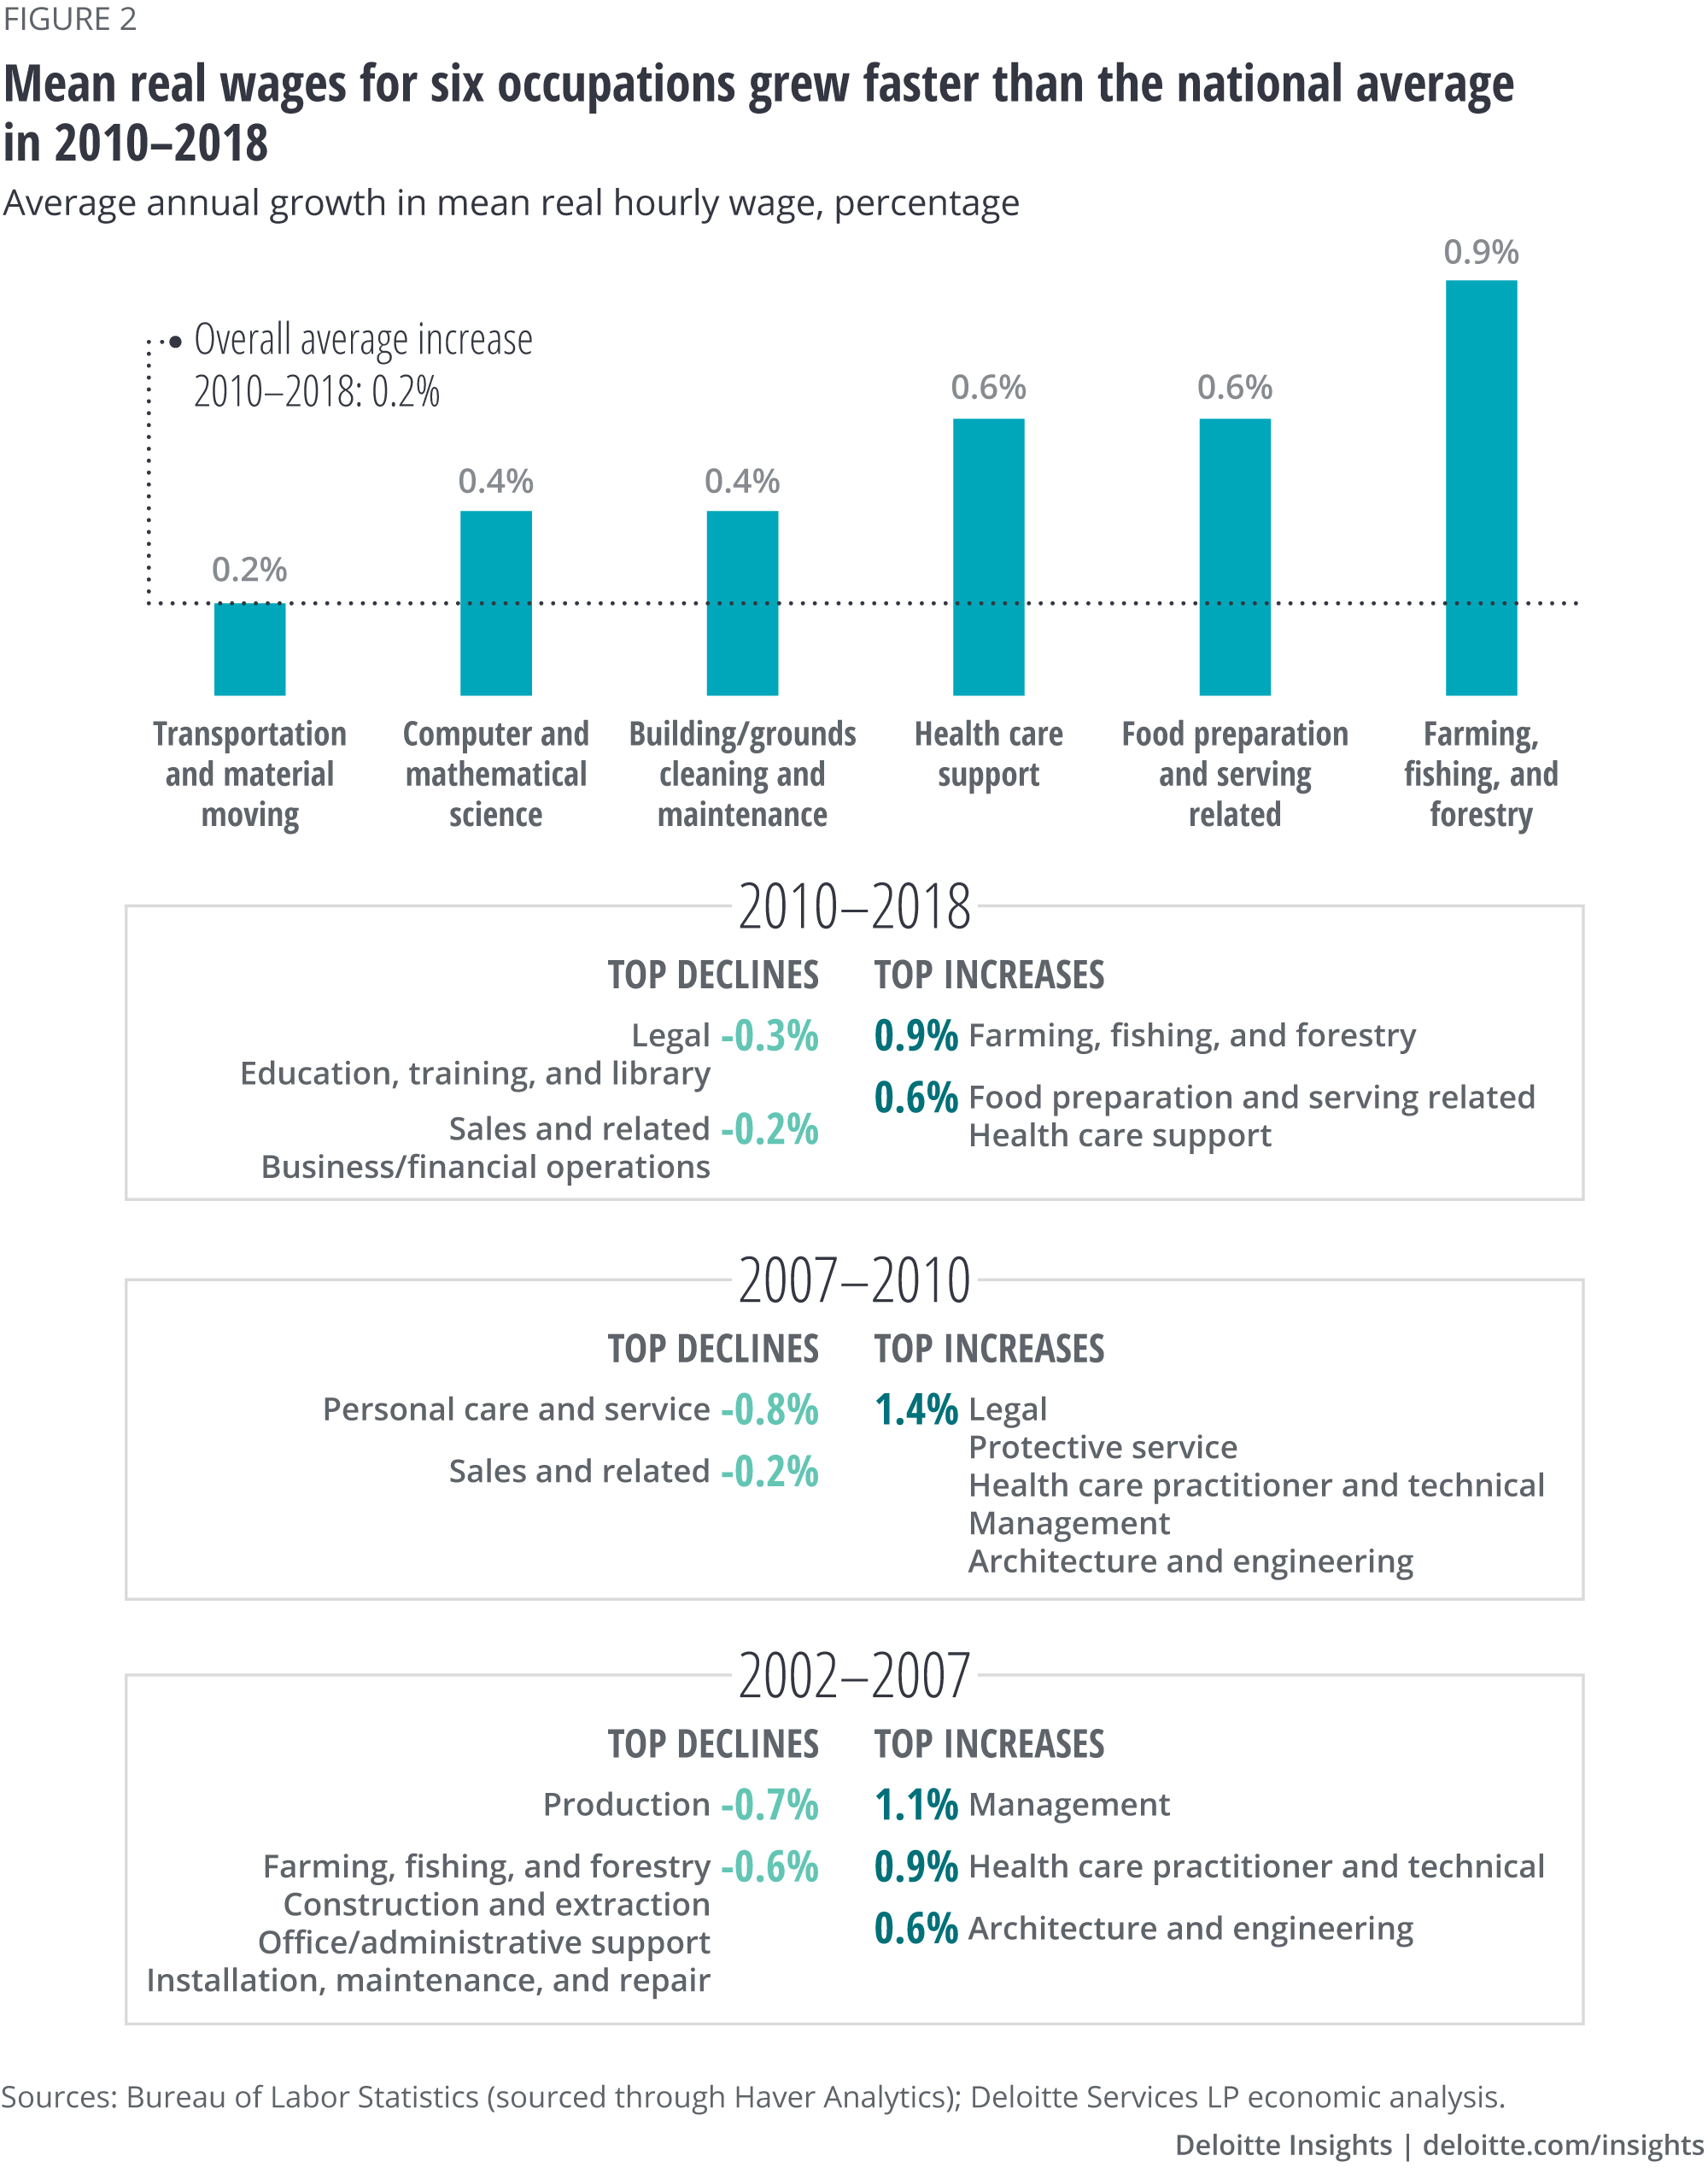
Overall, the six occupations that had the strongest wage growth in 2010–2018 accounted for only 25.6 percent of total employment in 2018. In contrast, employment rose higher than the national average in 11 major occupations between 2010 and 2018 (figure 3); these 11 occupations made up nearly half of all employment in 2018. Figure 3 also shows that the occupations driving employment growth in the recent expansion are not necessarily the same as those that aided employment growth in the expansion of 2002–2007. For example, health care support occupations and life, physical, and social science occupations were two notable drivers of employment growth during the previous recovery, but not in 2010–2018. It is interesting to note that not all occupations experienced declining employment during the downturn; employment grew in eight occupations in 2007–2010. And comparing employment growth for all occupations across the three periods, we find that employment has risen fairly consistently in health care practitioner and technical occupations—2.1 percent per year on average in 2002–2007, 2.2 percent in 2007–2010, and 2.1 percent in 2010–2018.
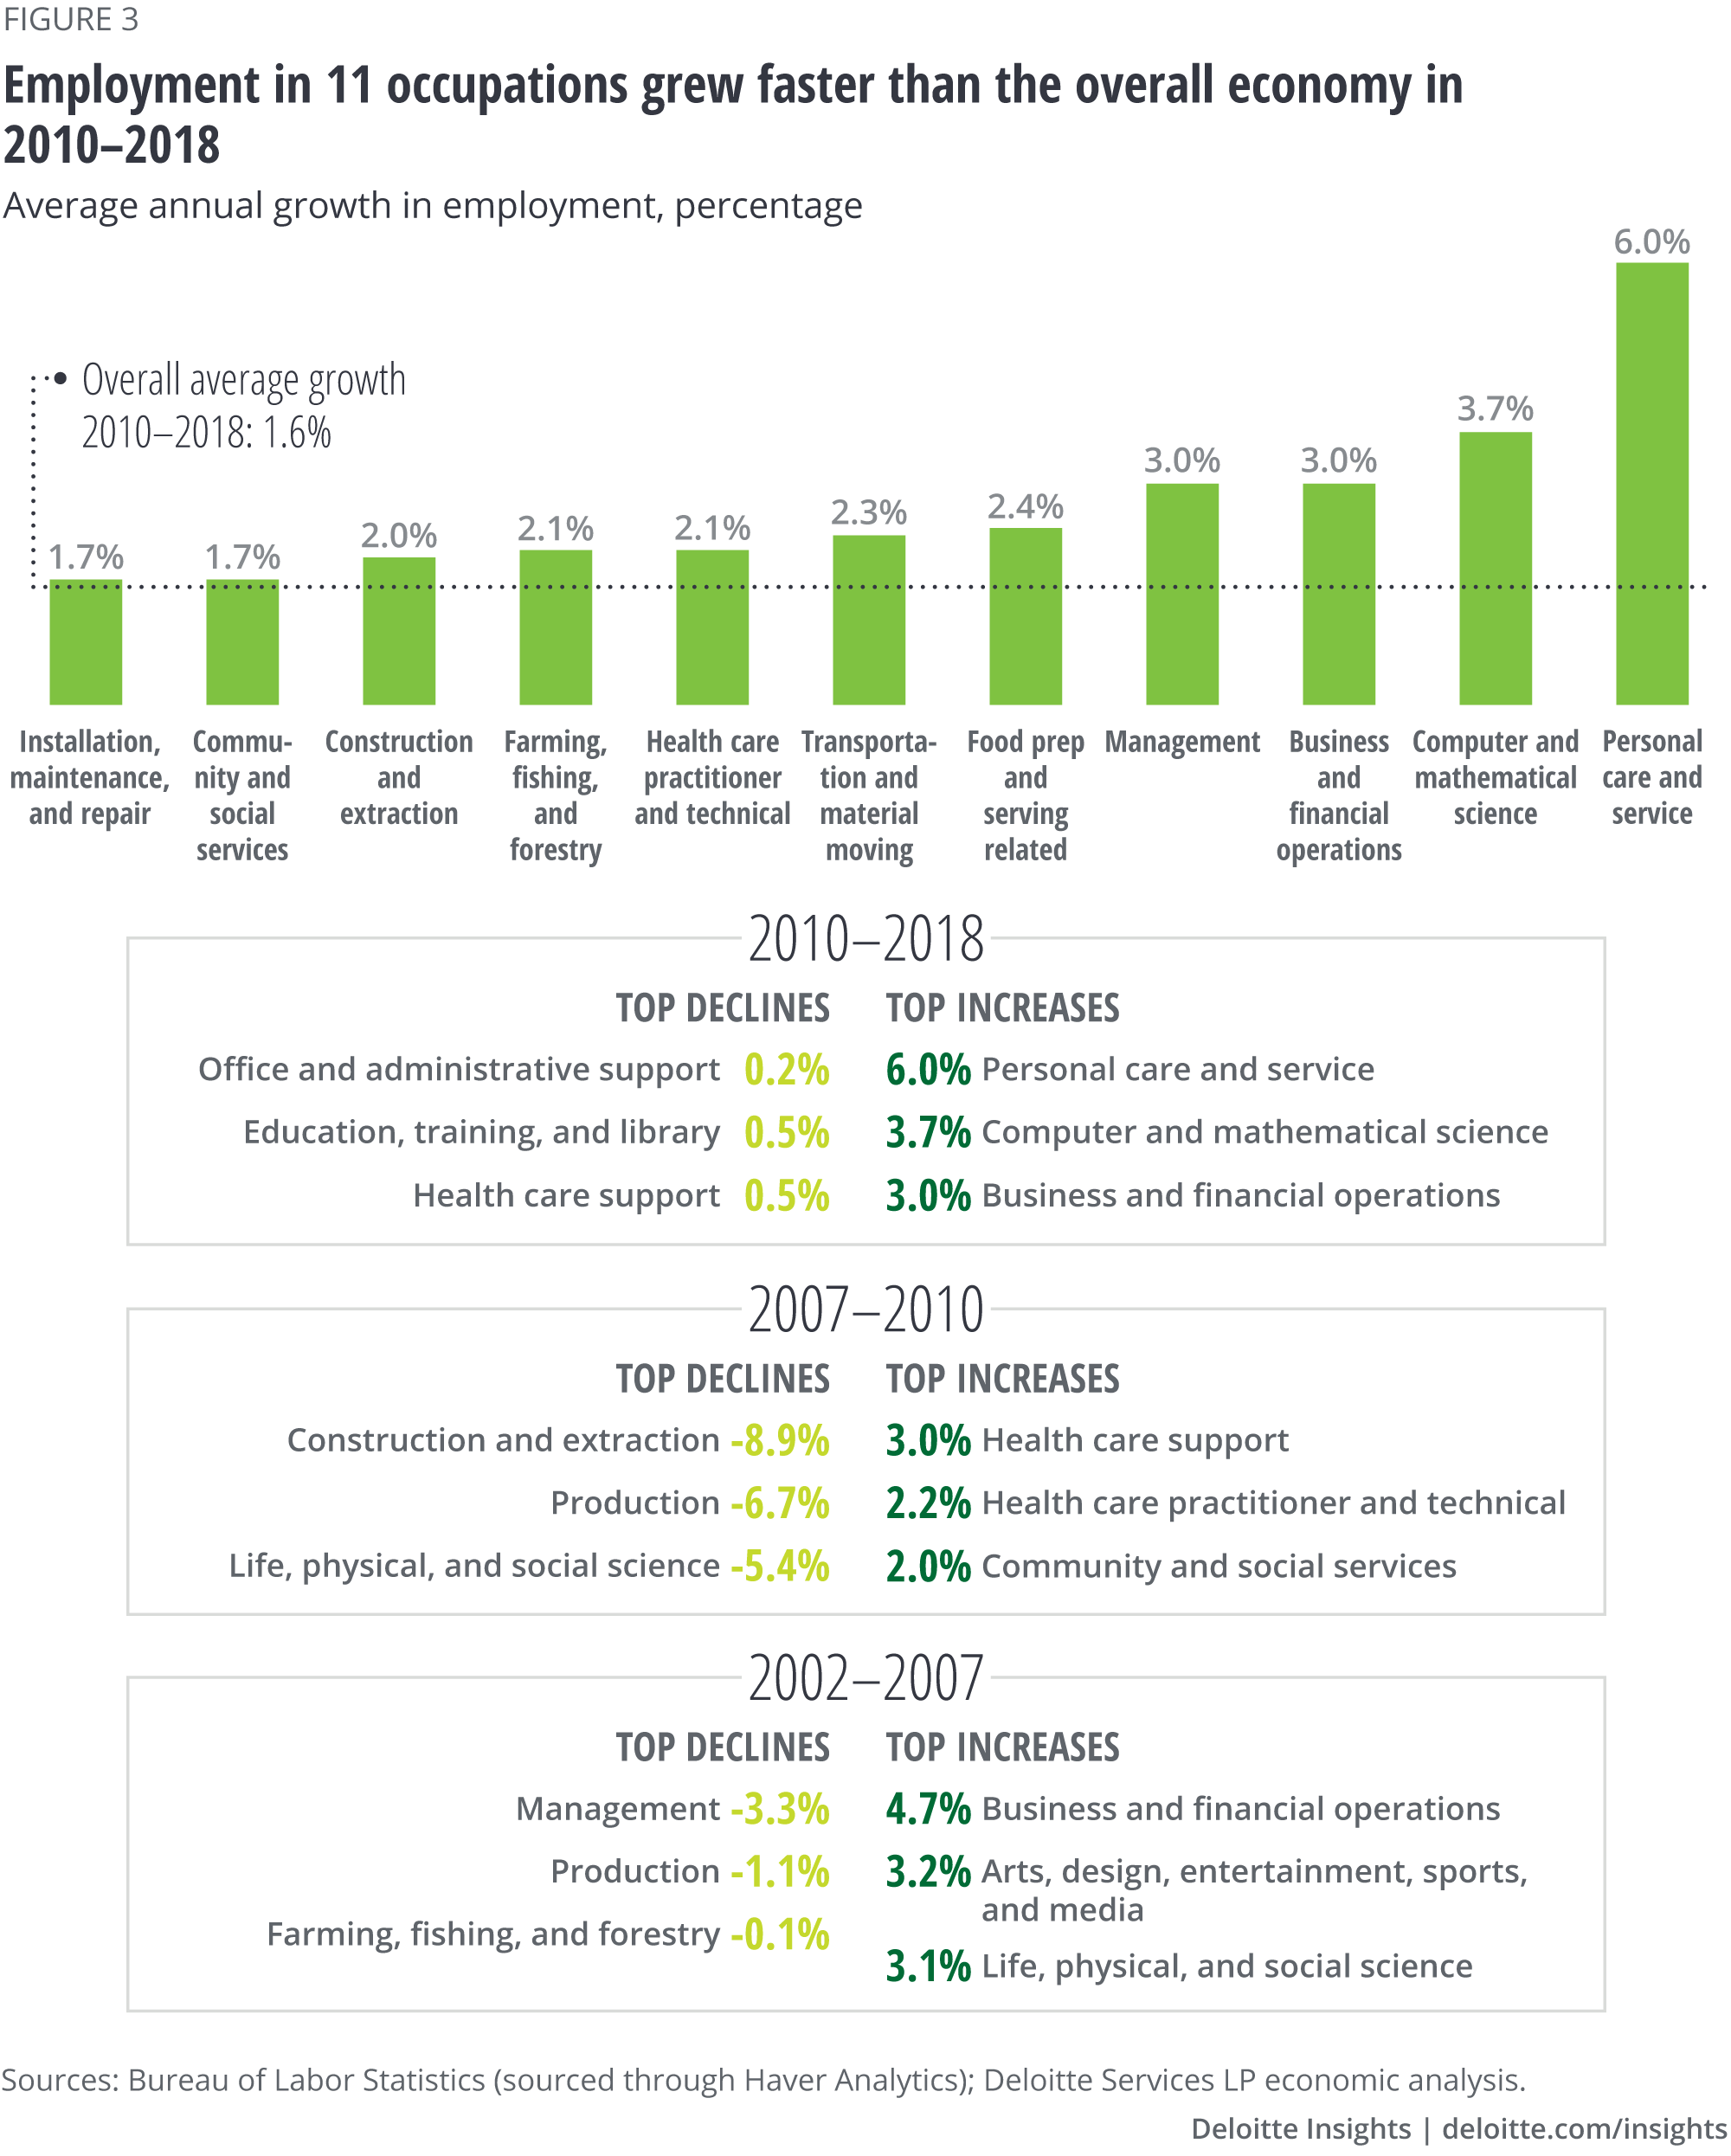
The lower share of employment in occupations that saw real wage increases compared to those that experienced gains in employment higher than the national average partly explains the relatively slower pace of real wage growth during the recent expansion. And for most occupations where mean real wages grew between 2010 and 2018, the pace of increase has also been relatively slow. Also, a comparison of both sets of occupations—real wage drivers and employment drivers—reveals that only three occupations are common to both lists. These are transportation and material moving occupations; computer and mathematical science occupations; and food preparation and serving-related occupations. In short, occupations driving employment growth are not the same as those pushing up real wages. Employment in management occupations, for example, grew by 3 percent on average per year between 2010 and 2018, but mean real wages in this category barely grew during this period.
Shifts that occurred in the more detailed occupational groupings underlying these broad categories are exerting influence on each of the occupational categories considered here. Some examples are presented in the appendix (A1).
Pulling wage and employment trends together: The recession shifted employment distribution toward more highly paid occupations in 2007–2010
Part of the reason for fast wage growth during the recession, followed by a return to a slower pace during the recent expansion, are changes in the occupational mix in employment in each period. Figure 4 shows the occupational shifts that occurred in 2007–2010. This collection of charts shows change in real wages and change in employment share for low, medium, and high wage occupational categories between 2007–2010.
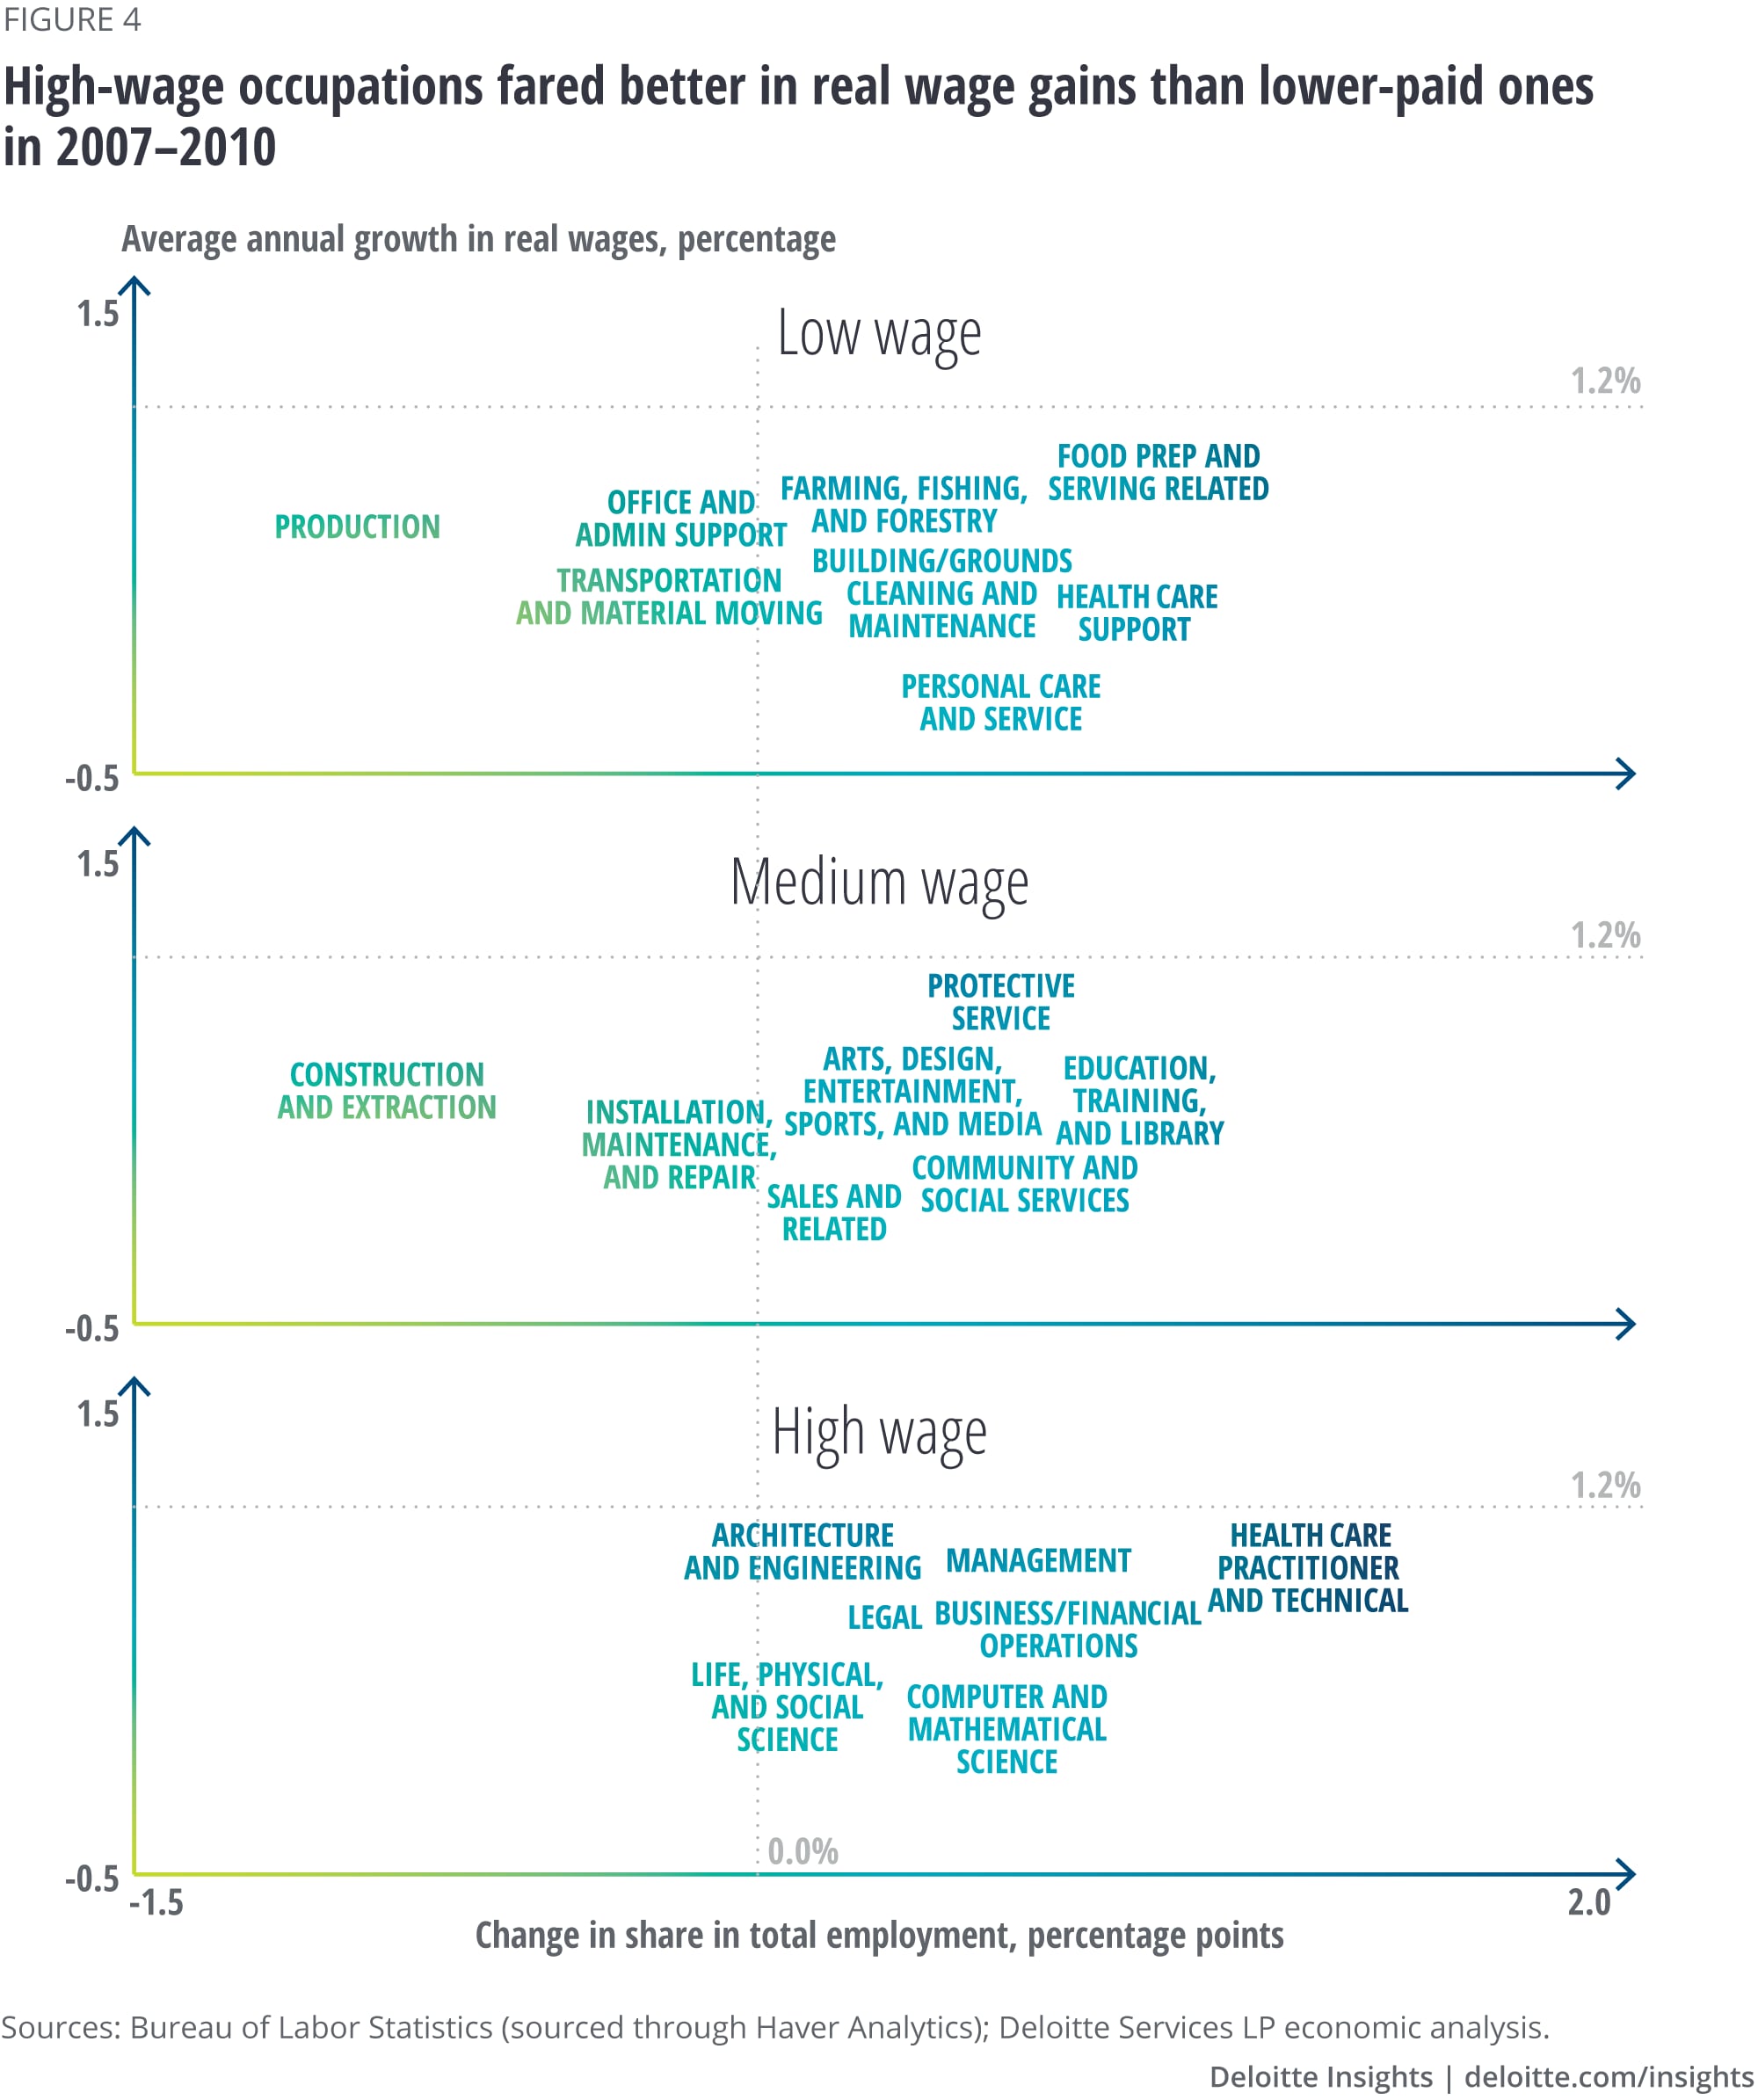
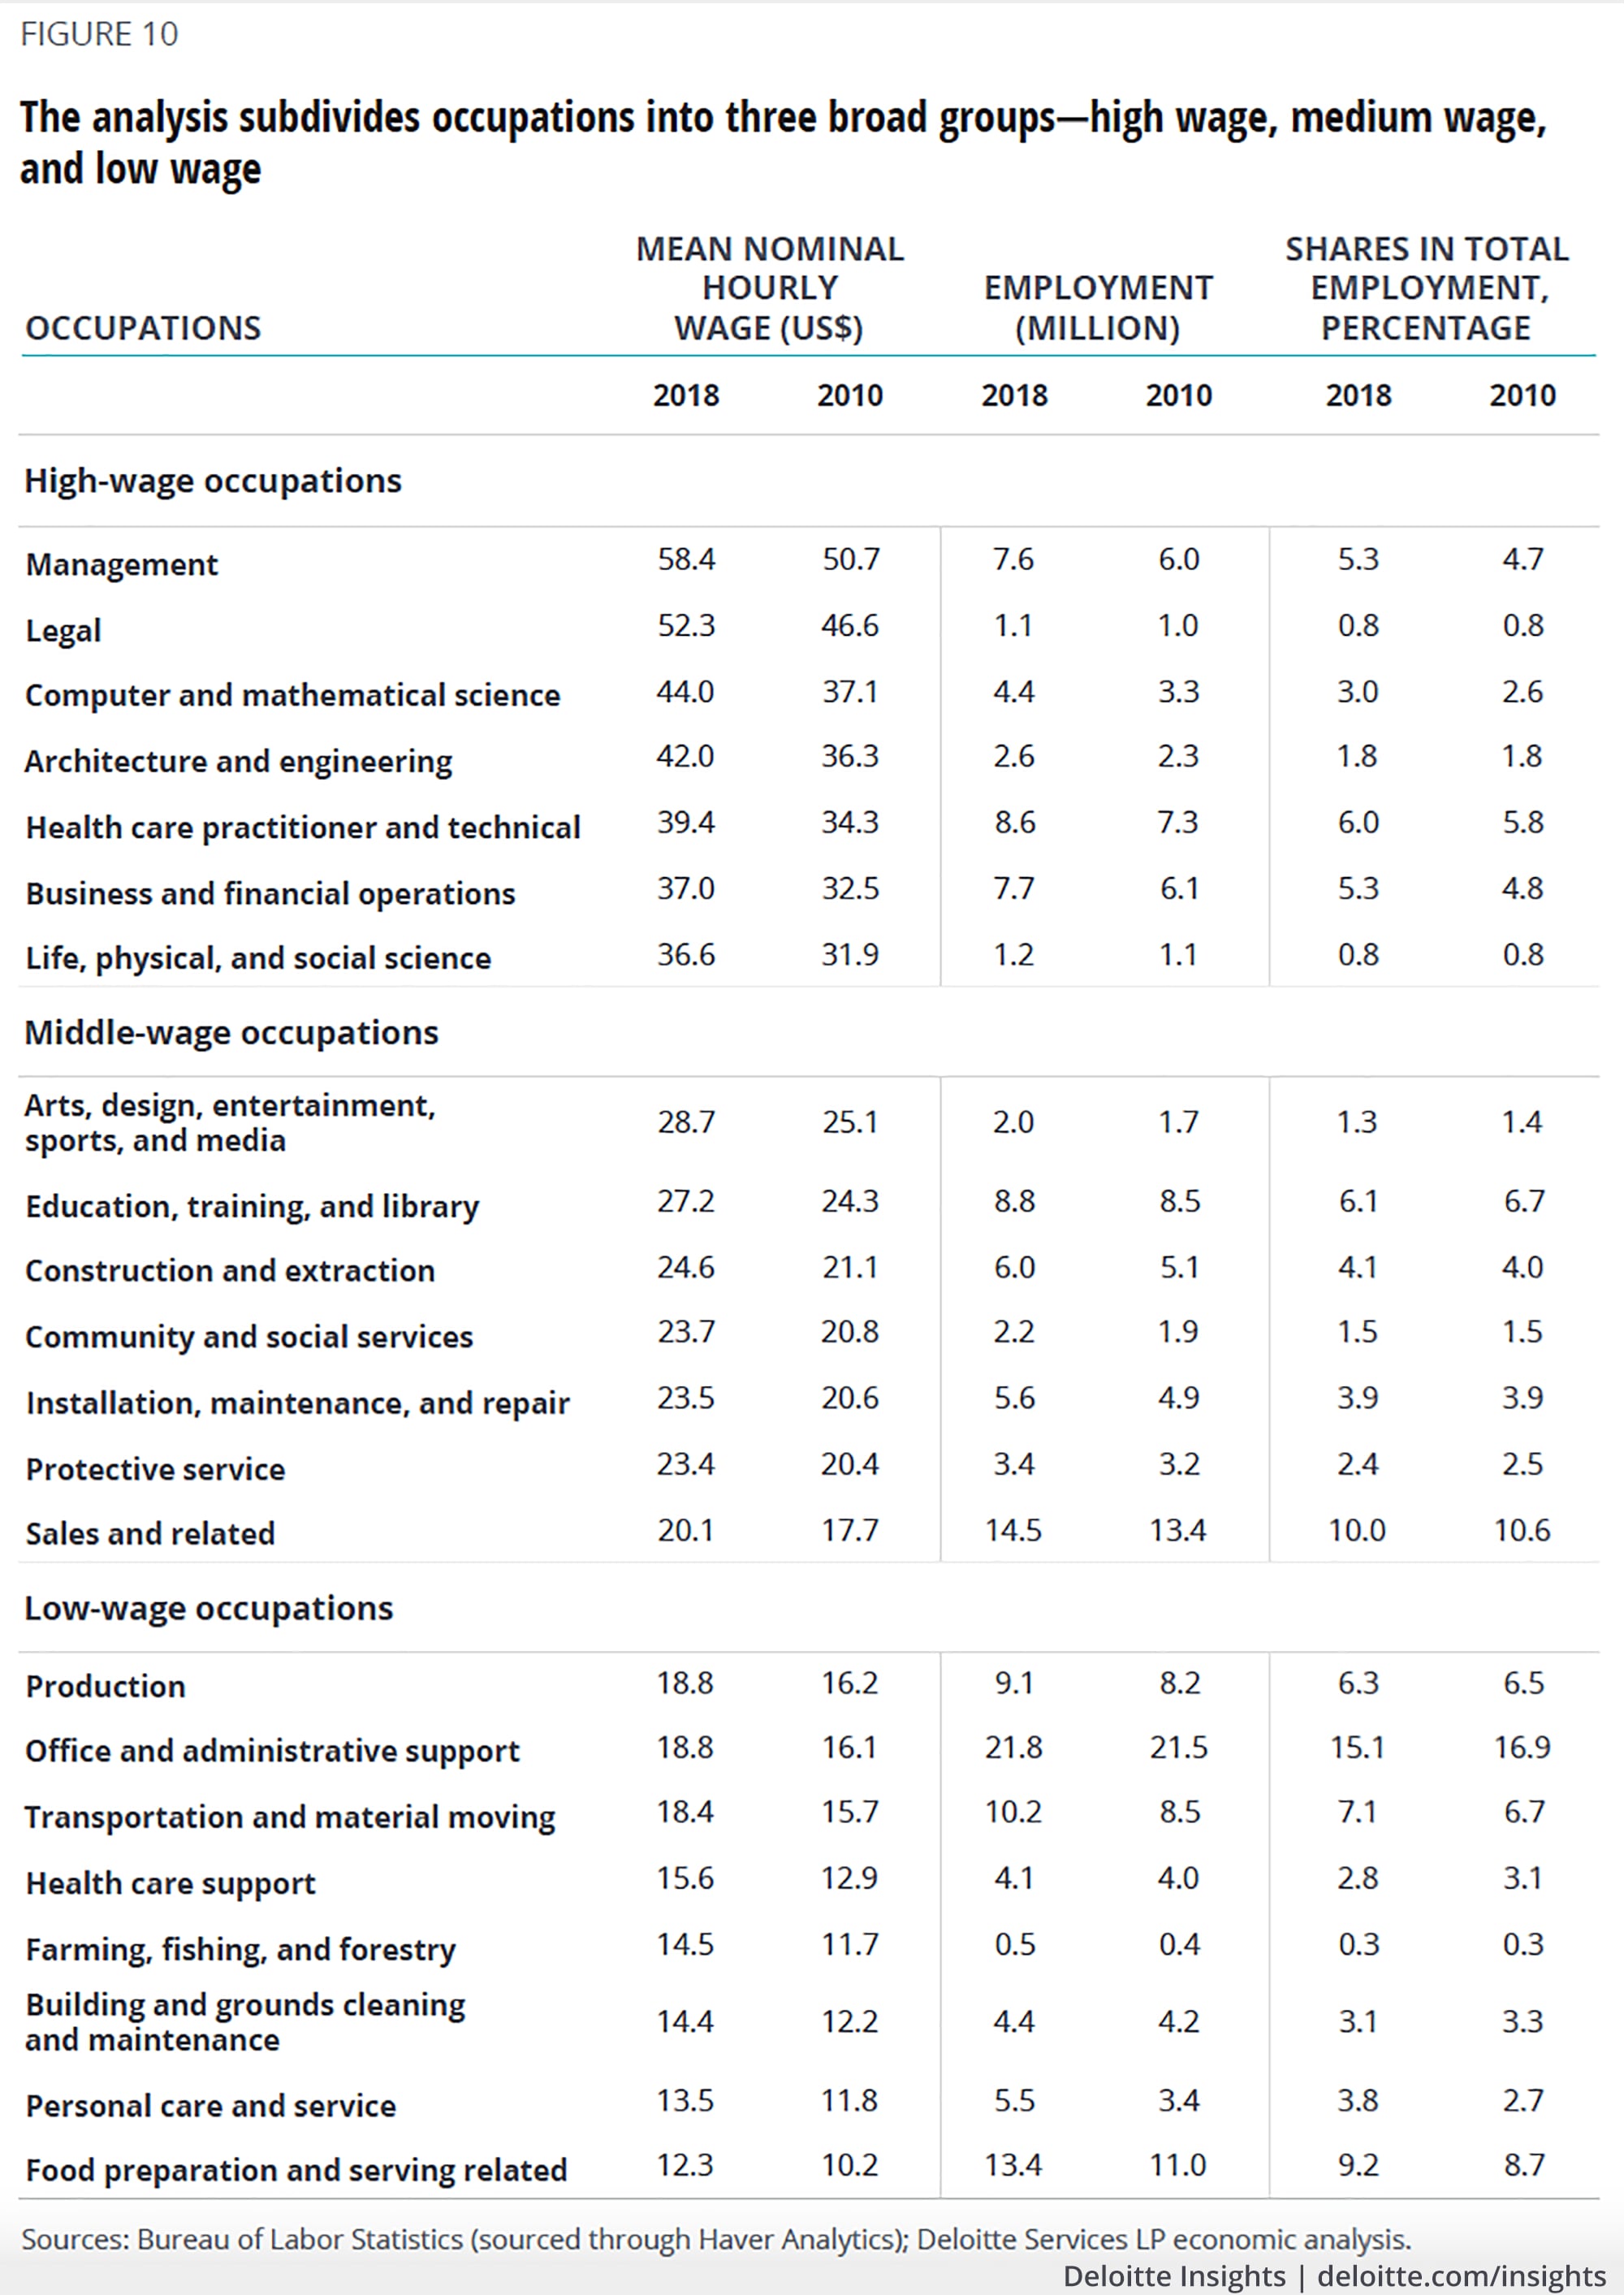
In the low wage group, wages range from US$10.2 per hour for food preparation and service-related occupations to US$16.2 per hour for production occupations. Three of these occupation groups gained in employment share and three lost employment share, with one (building and ground cleaning and maintenance occupations) maintaining employment share. As regards real wage gains, only food preparation and service-related occupations saw gains in mean real wages that exceeded the national average. Those working in personal care and service occupations saw the largest decline in mean real wages of any of the 22 occupations groups presented here—an average decline of 0.8 percent per year.
The middle chart in figure 4 has the occupations with mean nominal wages near the national average—ranging from US$17.7 per hour for sales and related occupations to US$25.1 per hour for occupations in arts, design, entertainment, sports, and media. Three of the occupations in this group lost employment share during the recession, with construction and extraction occupations losing a percentage point of employment share over the period. Only one of the occupations in this group (protective services) saw an increase in real wages above the national average and one (sales and related occupations) experienced an absolute decline.
The bottom chart shows the high-wage occupations10 where the nominal mean hourly wage in 2010 was between US$31.9 (life, physical, and social science occupations) and US$50.7 (management occupations). Health care practitioner and medical technical occupations showed the largest gain in employment share (increasing by 0.7 percentage points) over this period. The other high-paying occupations either had more modest gains or maintained their position, with one exception—life, physical, and social science occupations, which had a slight drop in employment share. As regards changes in mean real wages across the period, the high-wage group also did well with four of the seven occupations witnessing higher wage growth than the overall average; the others too saw positive wage growth.
Taken together, the data shows that the 1.2 percent average annual growth in mean real wages during the recession was reflective of an economy shedding lower-paying occupations. This was evidenced by the decline in employment shares in six of the 14 middle- and low-paying occupations. The higher-paying occupations, meanwhile, were mostly increasing their share in total employment. That the higher-paying occupations also tended to have higher wage increases further supported an increase in the national average wage during this period.
Slowing wage growth in high-wage occupations weighed on overall wage gains in 2010–2018
While most of the high-wage occupations continue to increase their employment share in the economy during the recent expansion—thereby exerting upward pressure on the national nominal mean wage—the contribution from real wage growth in these occupations is less than during the recession. The mean nominal wage was US$25.0 per hour in 2018 and the mean real wage growth in 2010–2018 was 0.2 percent per year on average.
As shown in figure 5, even as real wage growth slowed among the high-wage occupations during the recent expansion, the fastest growth accrued to occupations in the lowest paid group—farming, fishing, and forestry occupations (0.9 percent per year on average) and food preparation and serving-related occupations (0.6 percent).
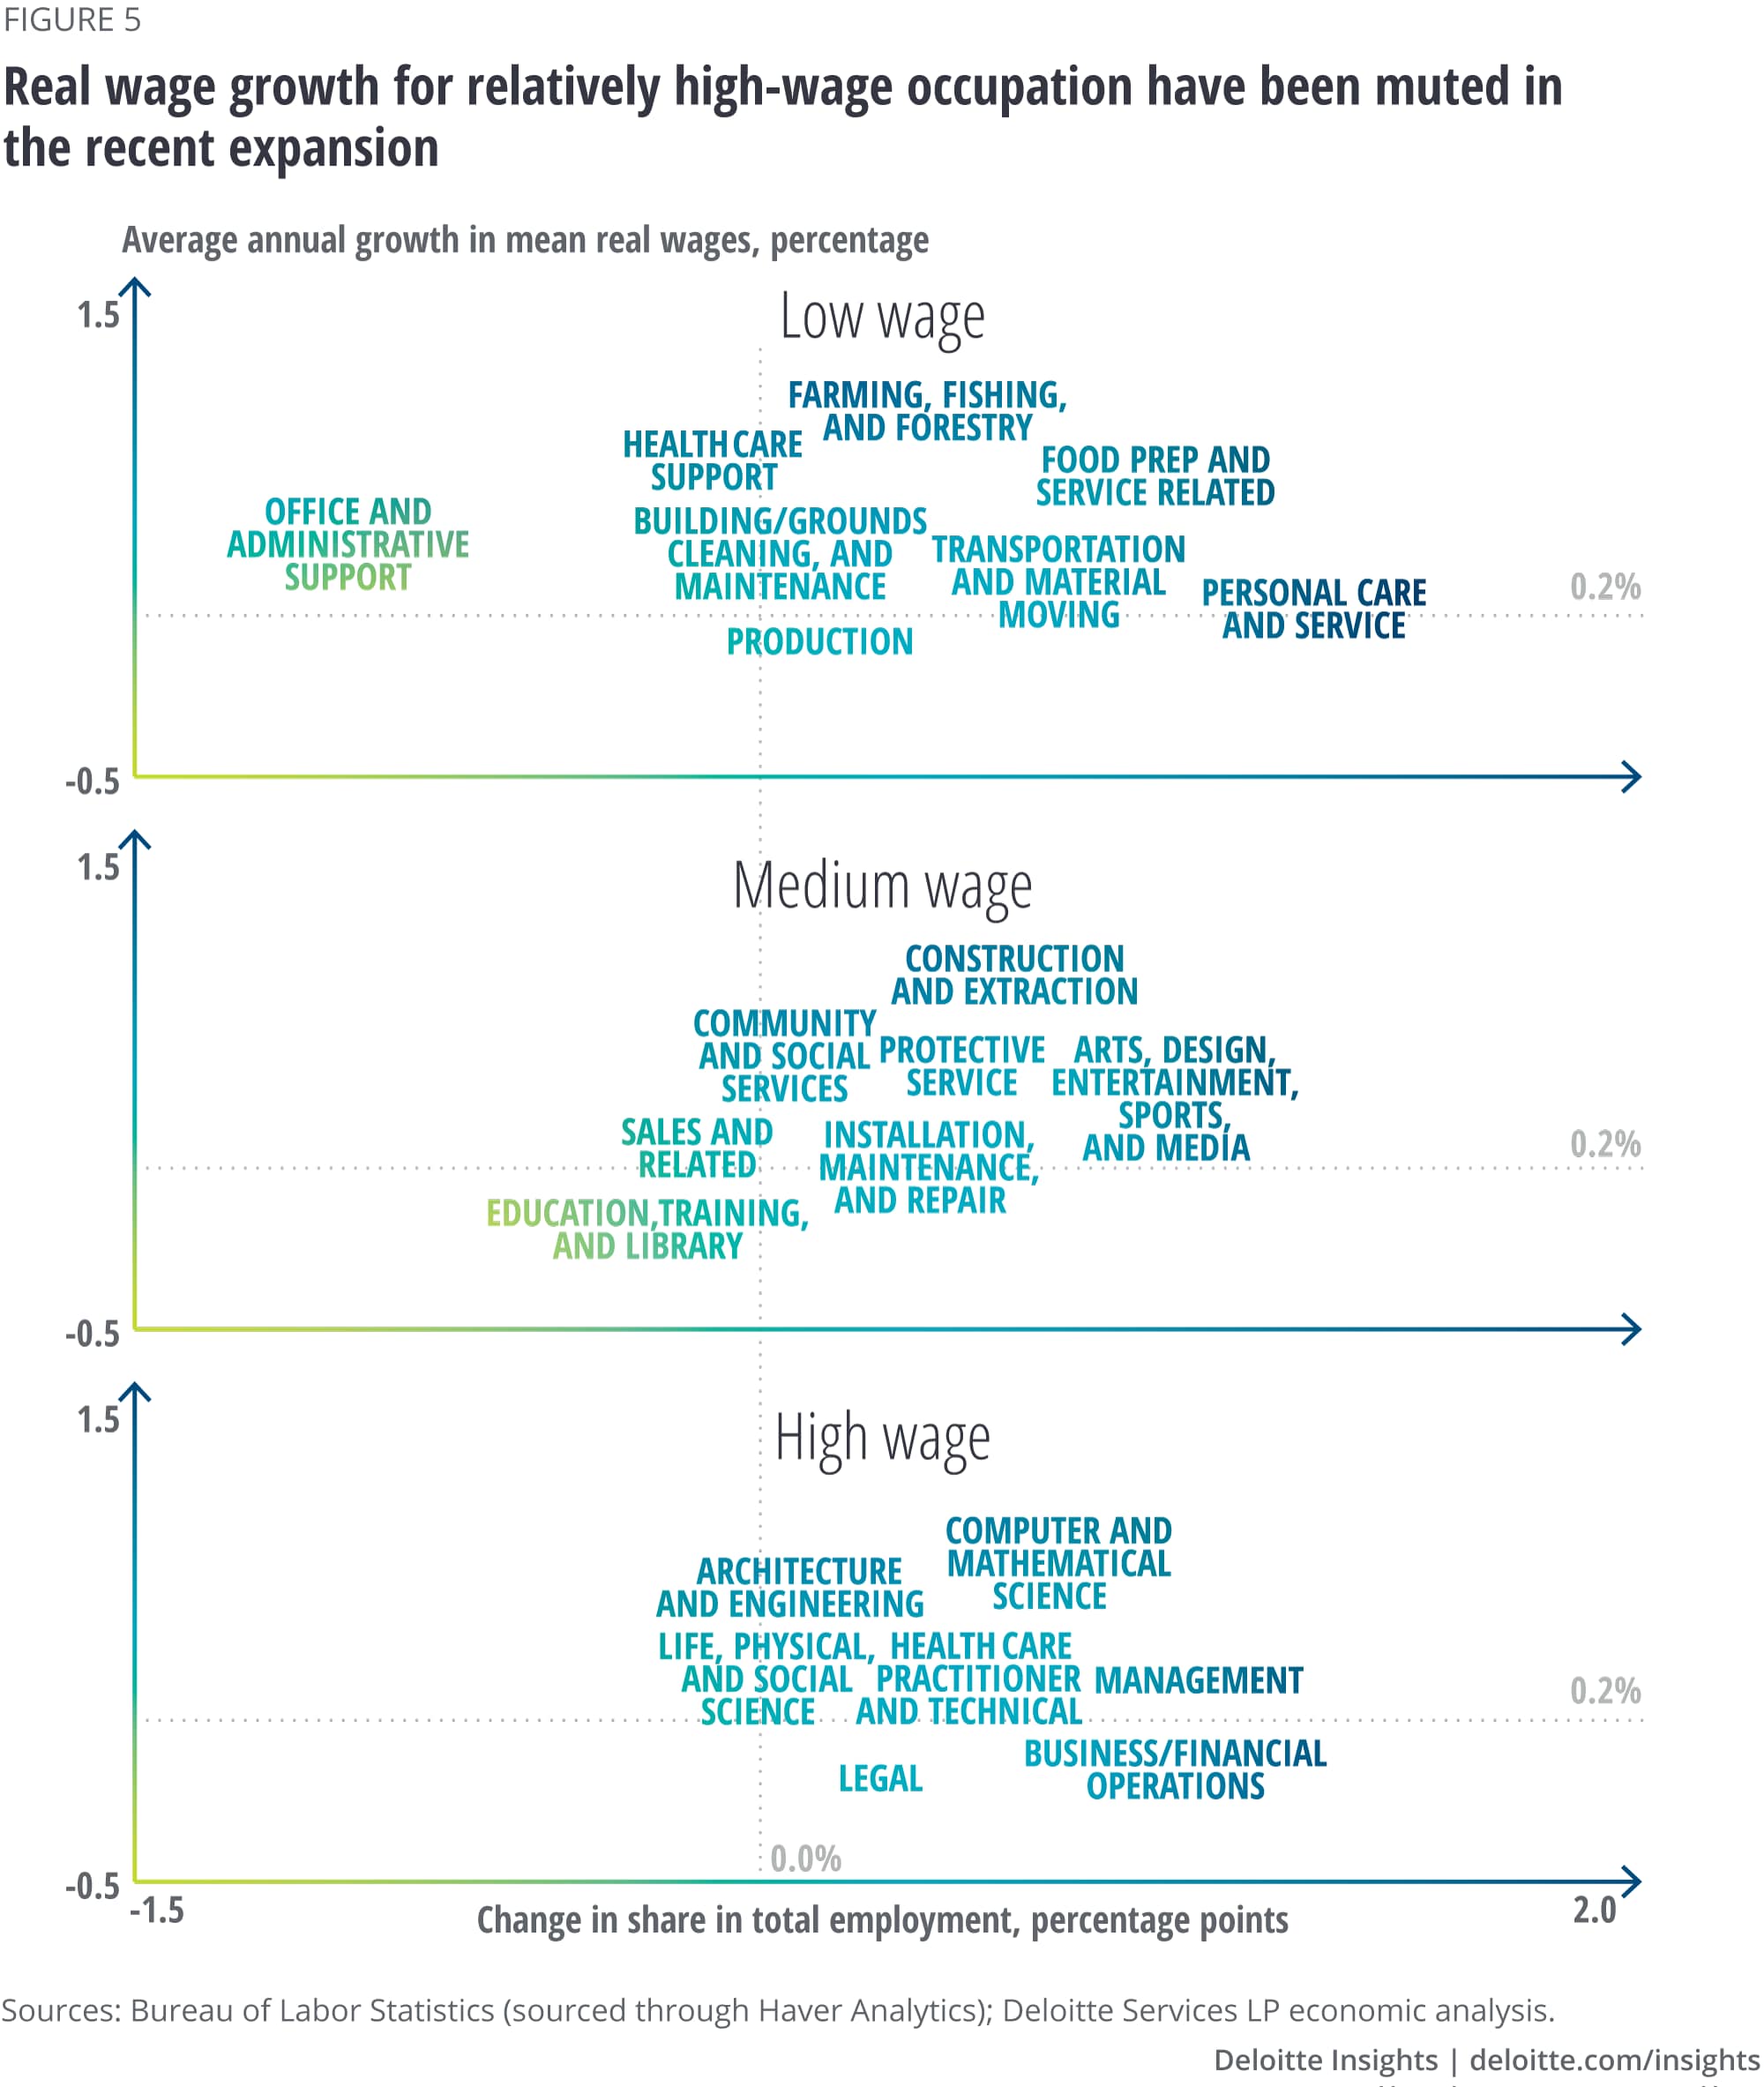
During the recession, mean real wages for the high-wage occupations grew by between 0.6 percent to 1.4 percent per year on average. In the recent expansion, however, average annual growth in mean real wages in this group is much lower, ranging from -0.3 percent (legal occupations) to 0.4 percent (computer and mathematical science occupations).
Another major difference between the occupational shifts during the recession and in the recent expansion is the strong growth in employment share of the two lowest-wage occupational categories between 2010 and 2018. Food preparation and serving-related occupations (US$12.3 per hour) and personal care occupations (US$13.5 per hour) had the lowest mean nominal wage of any of the occupations in 2018. In 2007–2010, the share of food preparation and serving-related occupations in total employment went up by 0.3 percentage points; the corresponding increase for personal care occupations was 0.2 percentage points. In the recent expansion, however, these two occupations have witnessed a much larger increase in share of total employment—by 0.6 and 1.1 percentage points, respectively.
Although employment share in the highest wage group did continue to increase during the expansion, the wage growth was slow. This, combined with the fact that there was stronger wage and employment growth in some of the lower-paid occupations in 2010–2018, has contributed to the downward pressure on the national average across all occupations.
Shifting sands of occupational mix weigh on wage dynamics
The US economy is most decidedly shifting its occupational mix toward higher-wage occupations. In 2007, the highest wage category accounted for 20 percent of employment, which then grew to 21.3 percent in 2010 and ended at 23 percent in 2018. The shifts occurring in middle- and low-wage occupations are mixed. The lowest-wage occupations lost the most in employment share during the recession (falling from 49.2 percent to 48.2 percent in 2007–2010), while the middle-wage group fell by less (falling from 30.8 to 30.5 percent). During the recent expansion, however, the situation has reversed—the middle-wage group reduced employment share by more (30.5 percent to 29.3 percent) and the lowest income group reduced its share by less (from 48.2 percent to 47.7 percent). The net result is that the 3 percentage point gain in the share of high-wage occupations between 2007 and 2018 came from middle-wage and low-wage occupations in equal proportion (1.5 percentage points each).
The shifting occupational mix during the recession, where jobs in middle- and low-wage occupations were lost at a faster pace than jobs in higher-wage occupations, combined with faster wage growth in these higher-wage occupations, contributed to the faster growth in overall average real wages. However, the role of the shifting occupational mix in the low rate of wage growth in the recent expansion is less clear. The increasing proportion of high-wage occupations would tend to push up average real wages, but the slow to negative wage growth in this group would tend to lower the growth in average wages. The higher wage growth in the low-wage occupations would have a smaller impact on the average because the growth is coming off a low base. While we do not have an explanation for the slow growth in wages of the high-wage occupations, the faster rate of wage growth in the low-wage occupations likely reflects, in part, increases to the minimum wage by some individual companies and states. This faster pace of wage growth for this group is likely to persist as minimum wage increases continue to be phased-in in a growing number of states.
Appendix
A1. Wage levels and real wage gains are not even within major occupations
The OES data also shows the disparity in wages between occupations. Mean real wages in management occupations, for example, are much higher than in food preparation and serving-related occupations. And within each occupation, wage gains are mixed for key suboccupations. Below is a short analysis of wage and employment trends since 2002 for suboccupations within four major occupations.
Food preparation and serving-related occupations: Food and beverage serving workers account for the largest share (57 percent in 2018) of employment in food preparation and serving-related occupations (figure 6). For these workers, the mean real wage grew by 1.6 percent on average per year in 2012–2018.11 In contrast, supervisors—who are better paid on average than the others—witnessed much slower growth in their mean real wage during this period. Overall, within food preparation and serving-related occupations, relatively lower-paid workers saw faster growth in real wages on average during this period than their higher-paid counterparts.

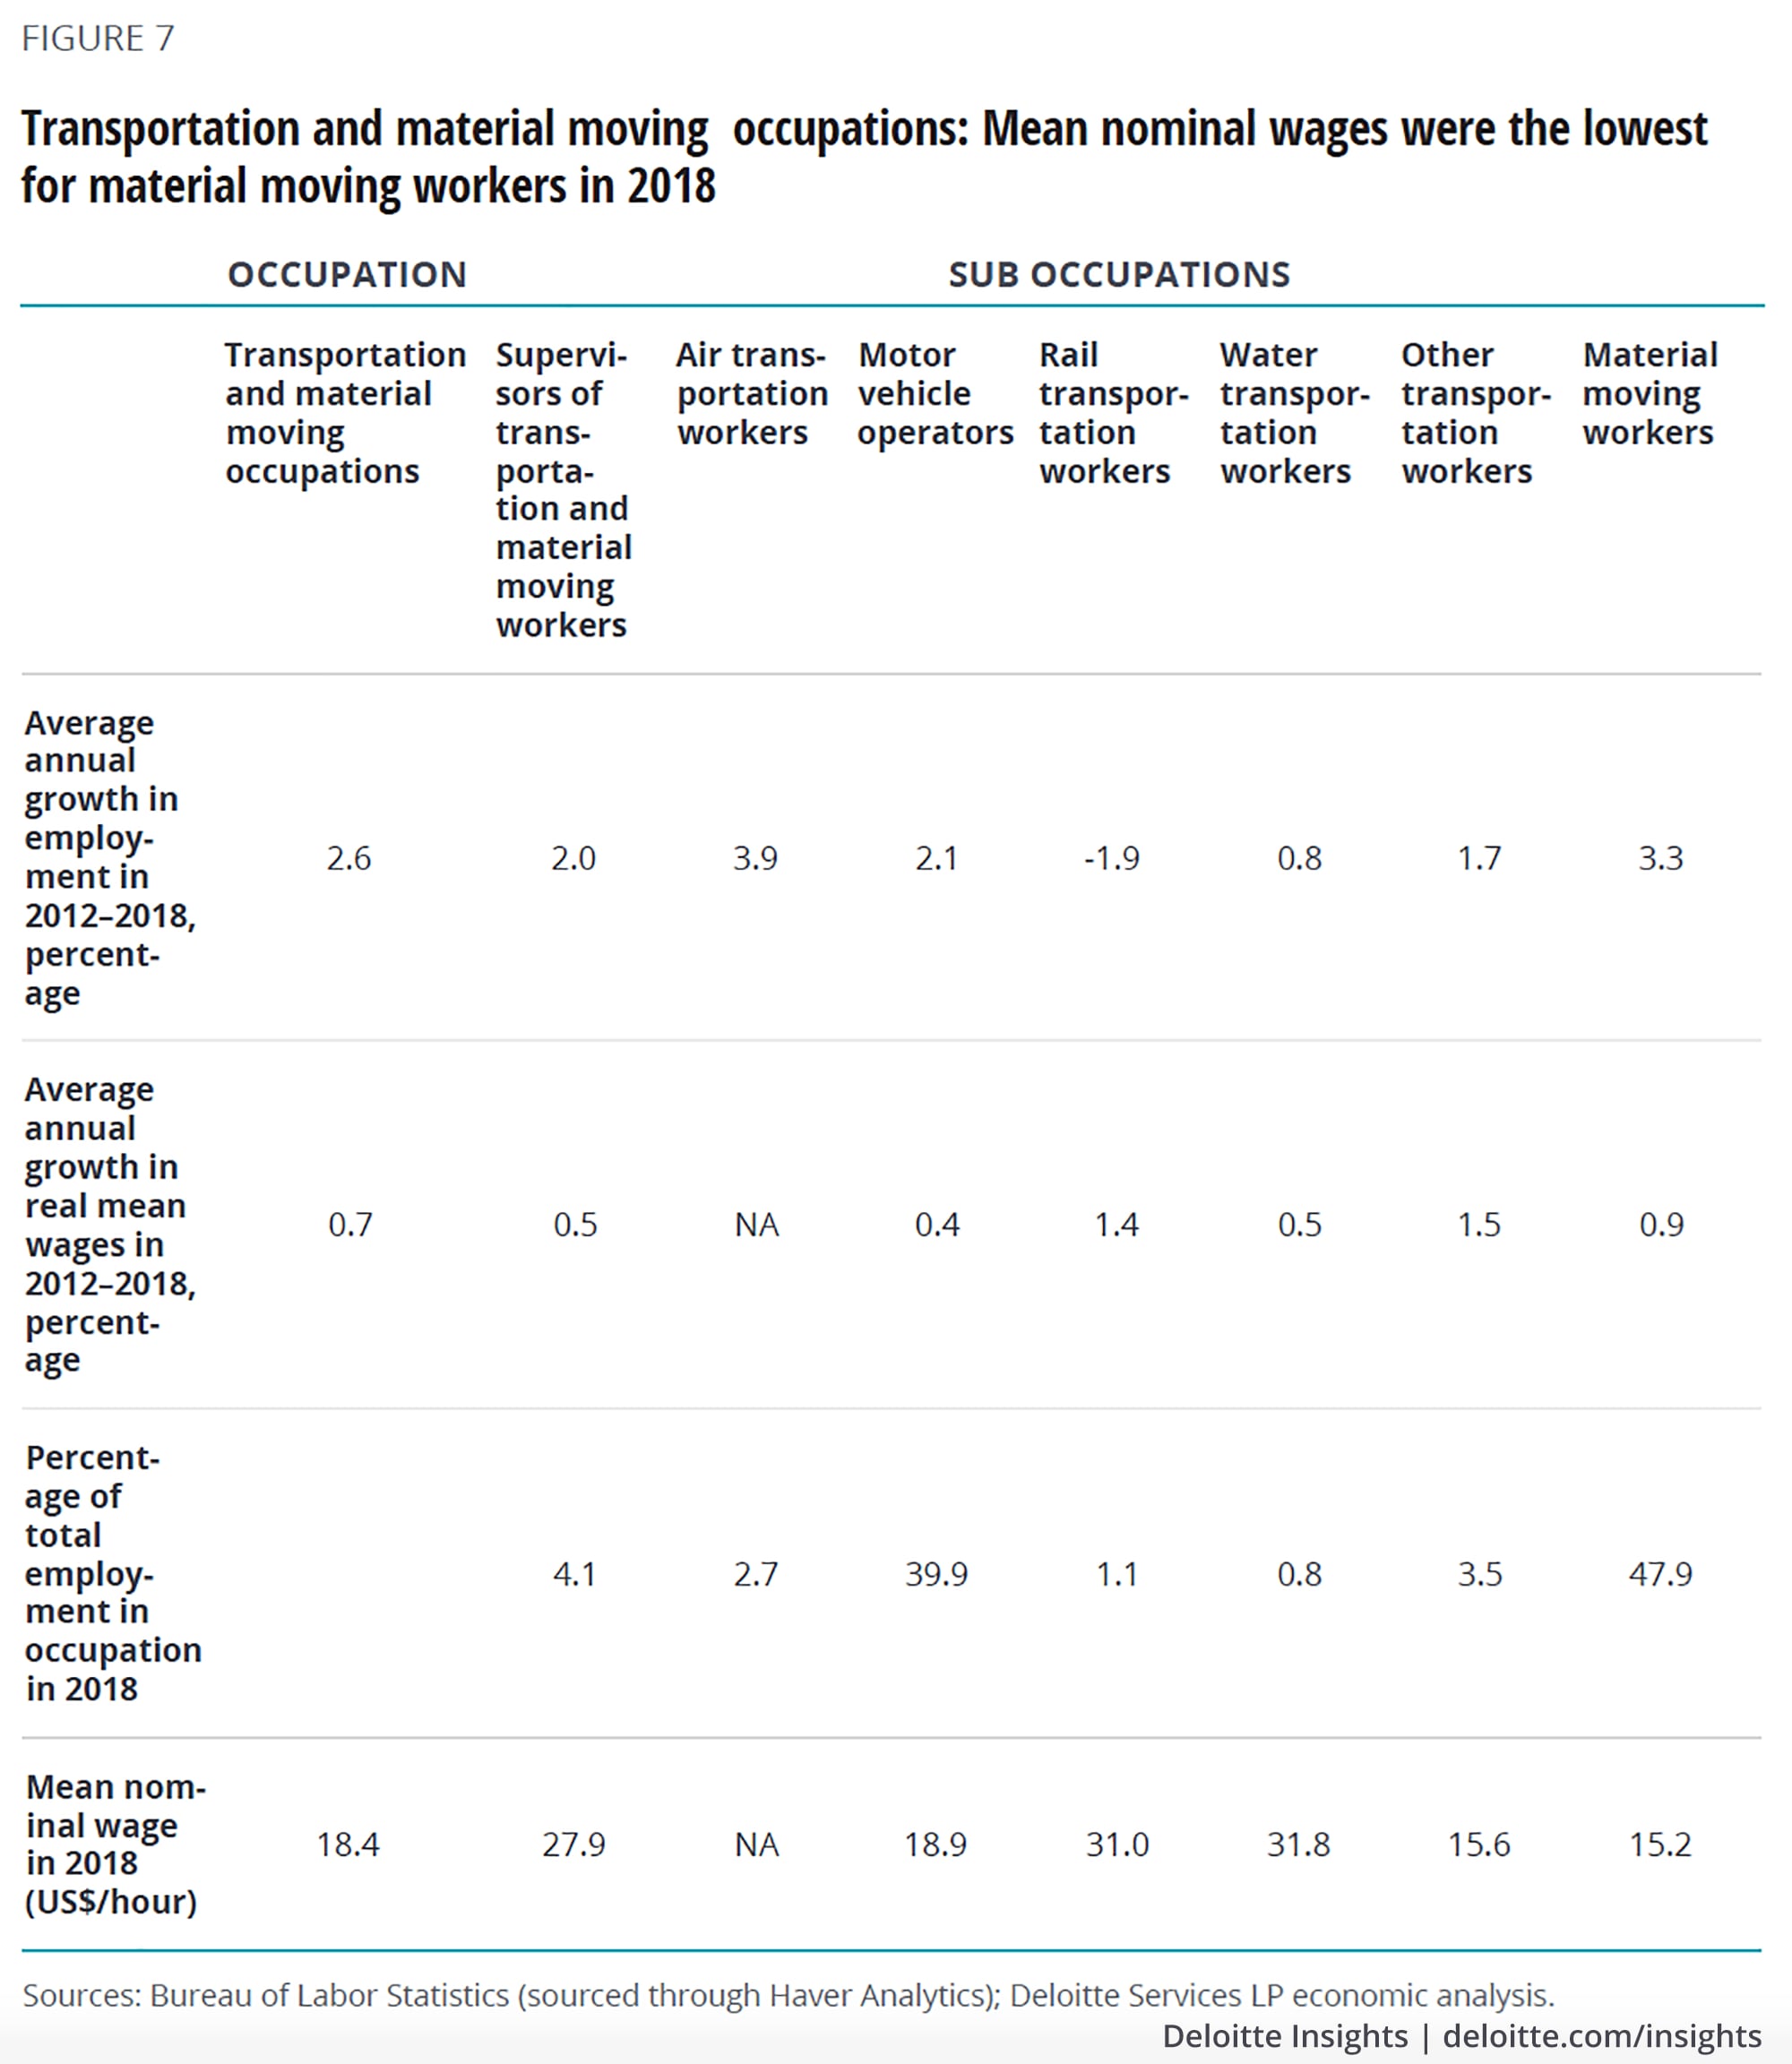
Transportation and material moving occupations: There is quite a bit of variation in wage levels within the key suboccupations of transportation and material moving. For example, material moving workers, who accounted for 47.9 percent of employment in the overall occupation in 2018, earned mean nominal wages much lower than supervisors who made up just 4.1 percent of employment (figure 7). Figure 7 shows there is no clear trend in real wage growth in transportation and material moving between 2012 and 2018: Among both higher- and relatively lower-paid workers, there were some who gained more than the overall average for the total occupation.
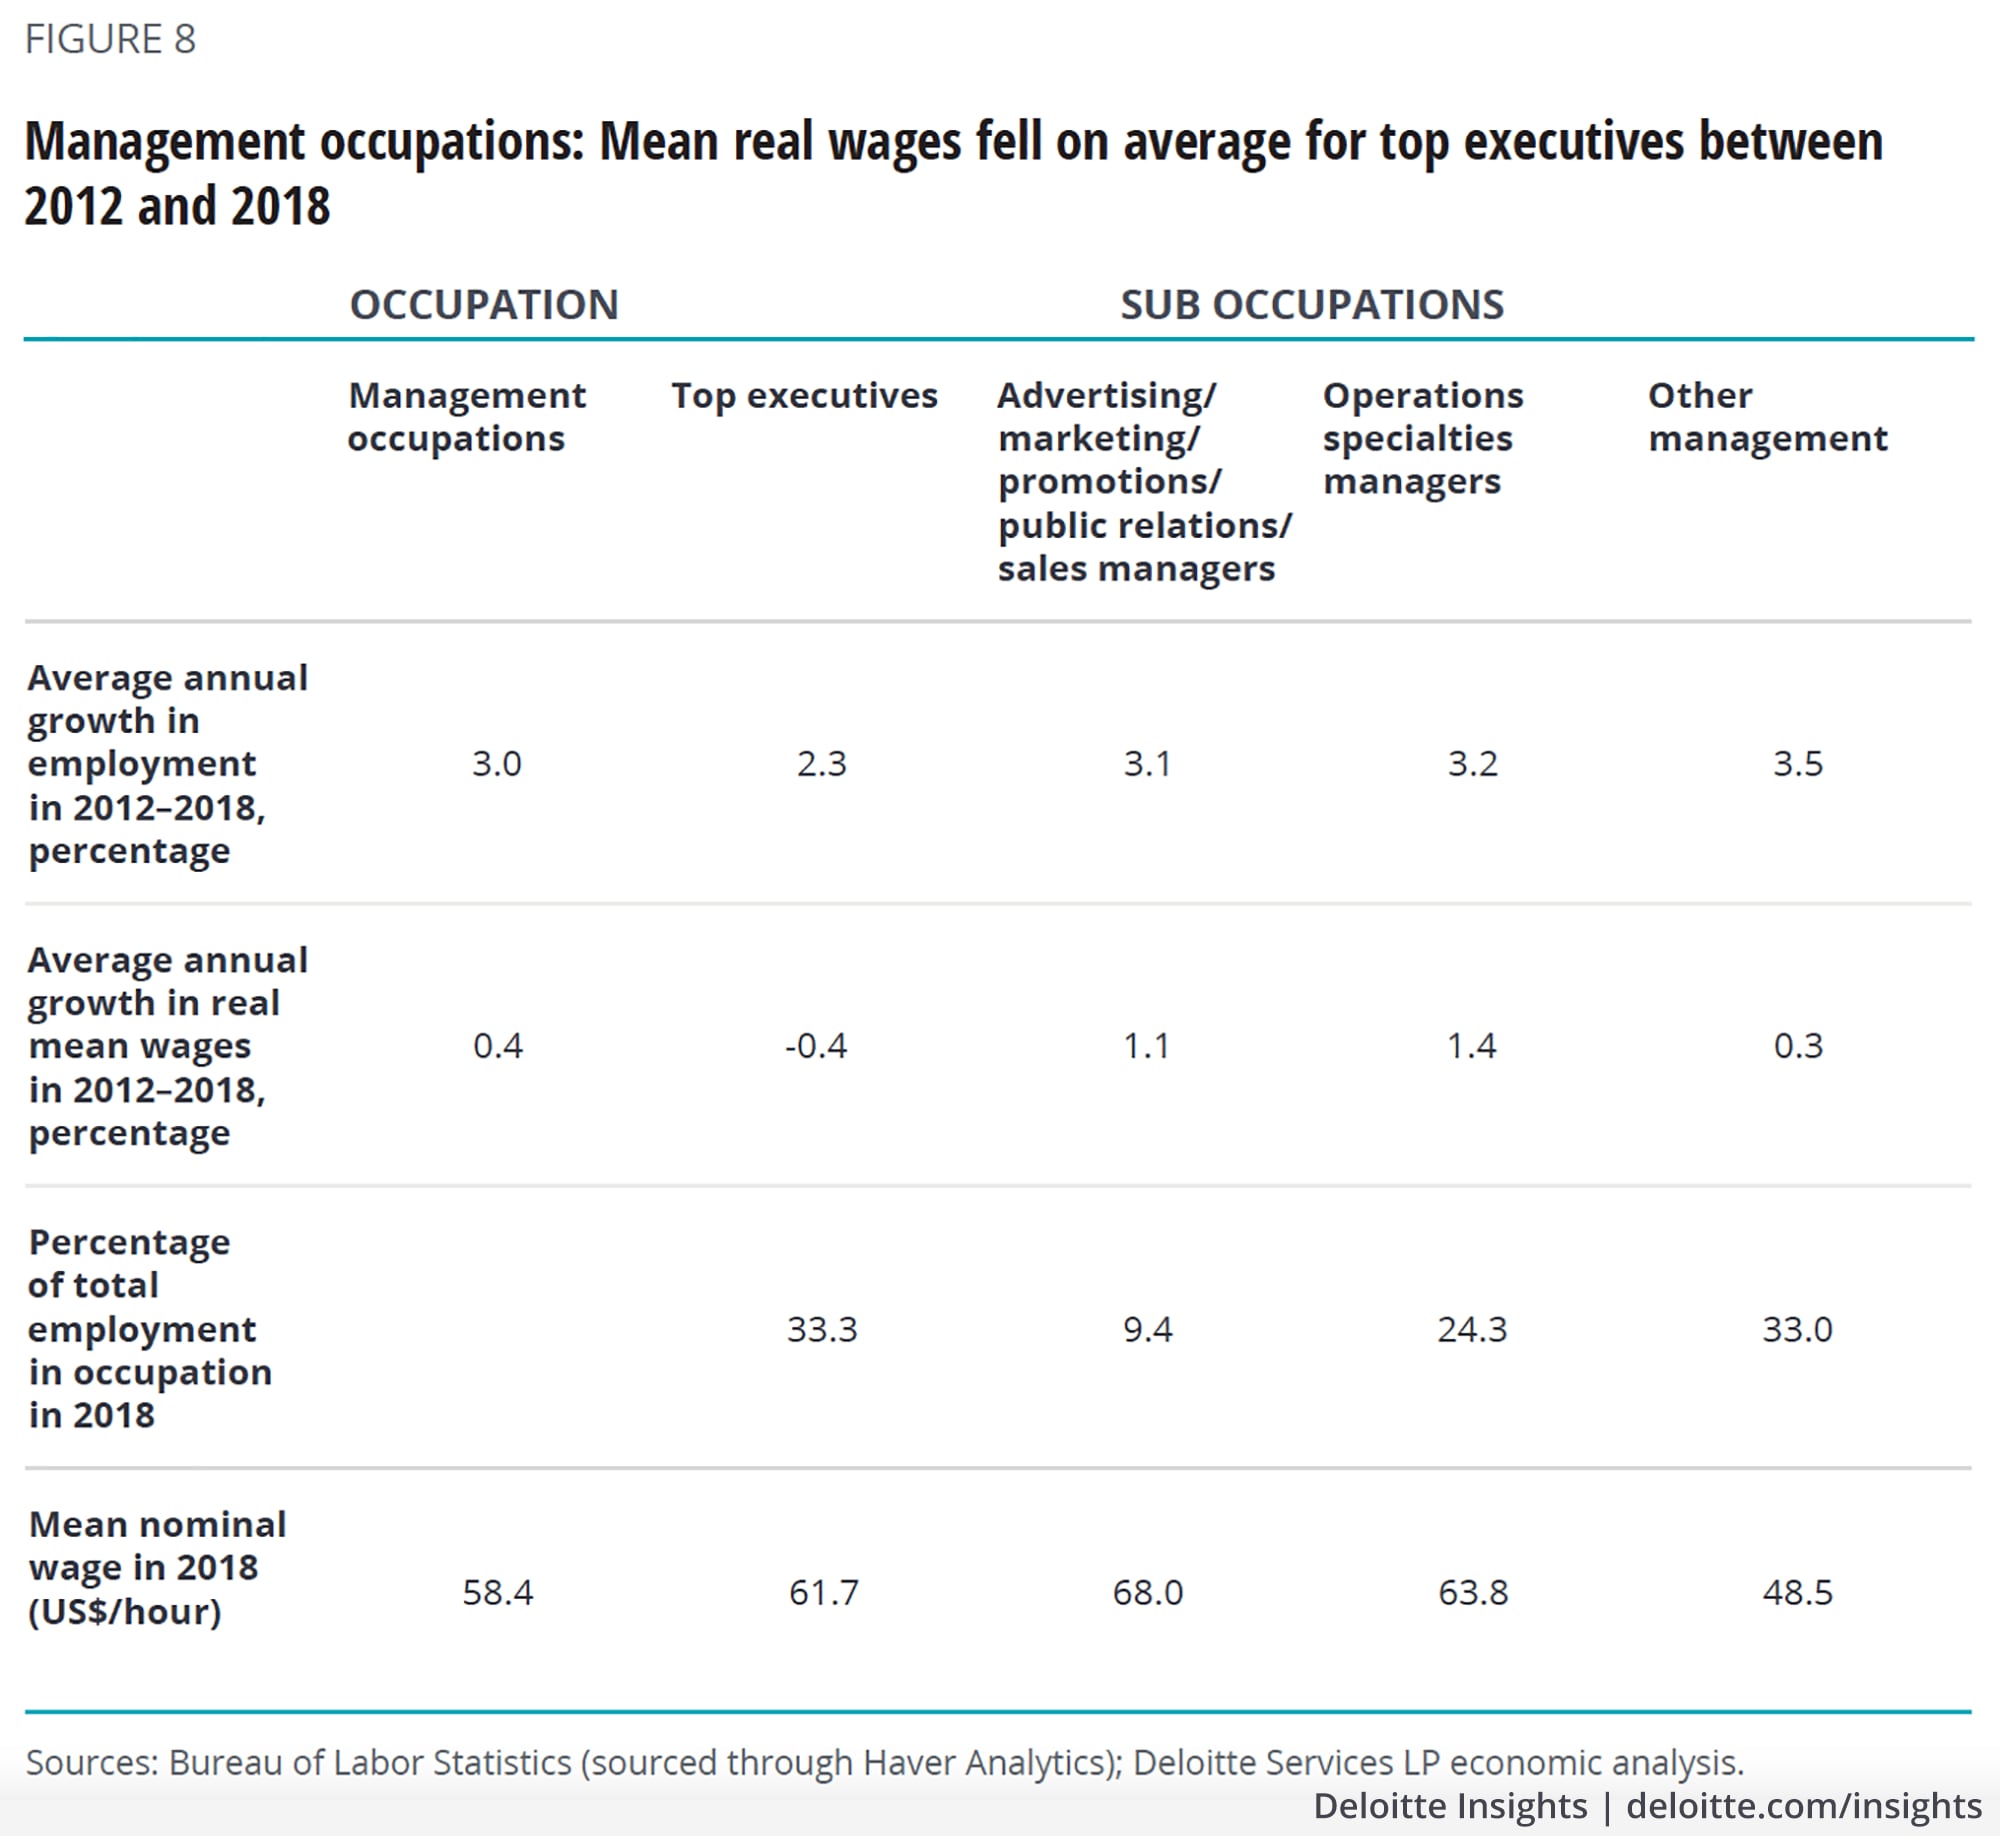
Management occupations: Management occupations earn the highest mean nominal wages among major occupations in the economy. Figure 8 shows that within management occupations, it is not the top executives who earn the highest mean nominal wage; rather advertising, marketing, promotions, public relations, and sales managers earned more on average in 2018. Top executives also did not fare well in terms of growth in their mean real wage, which fell by 0.4 percent on average per year between 2012 and 2018.
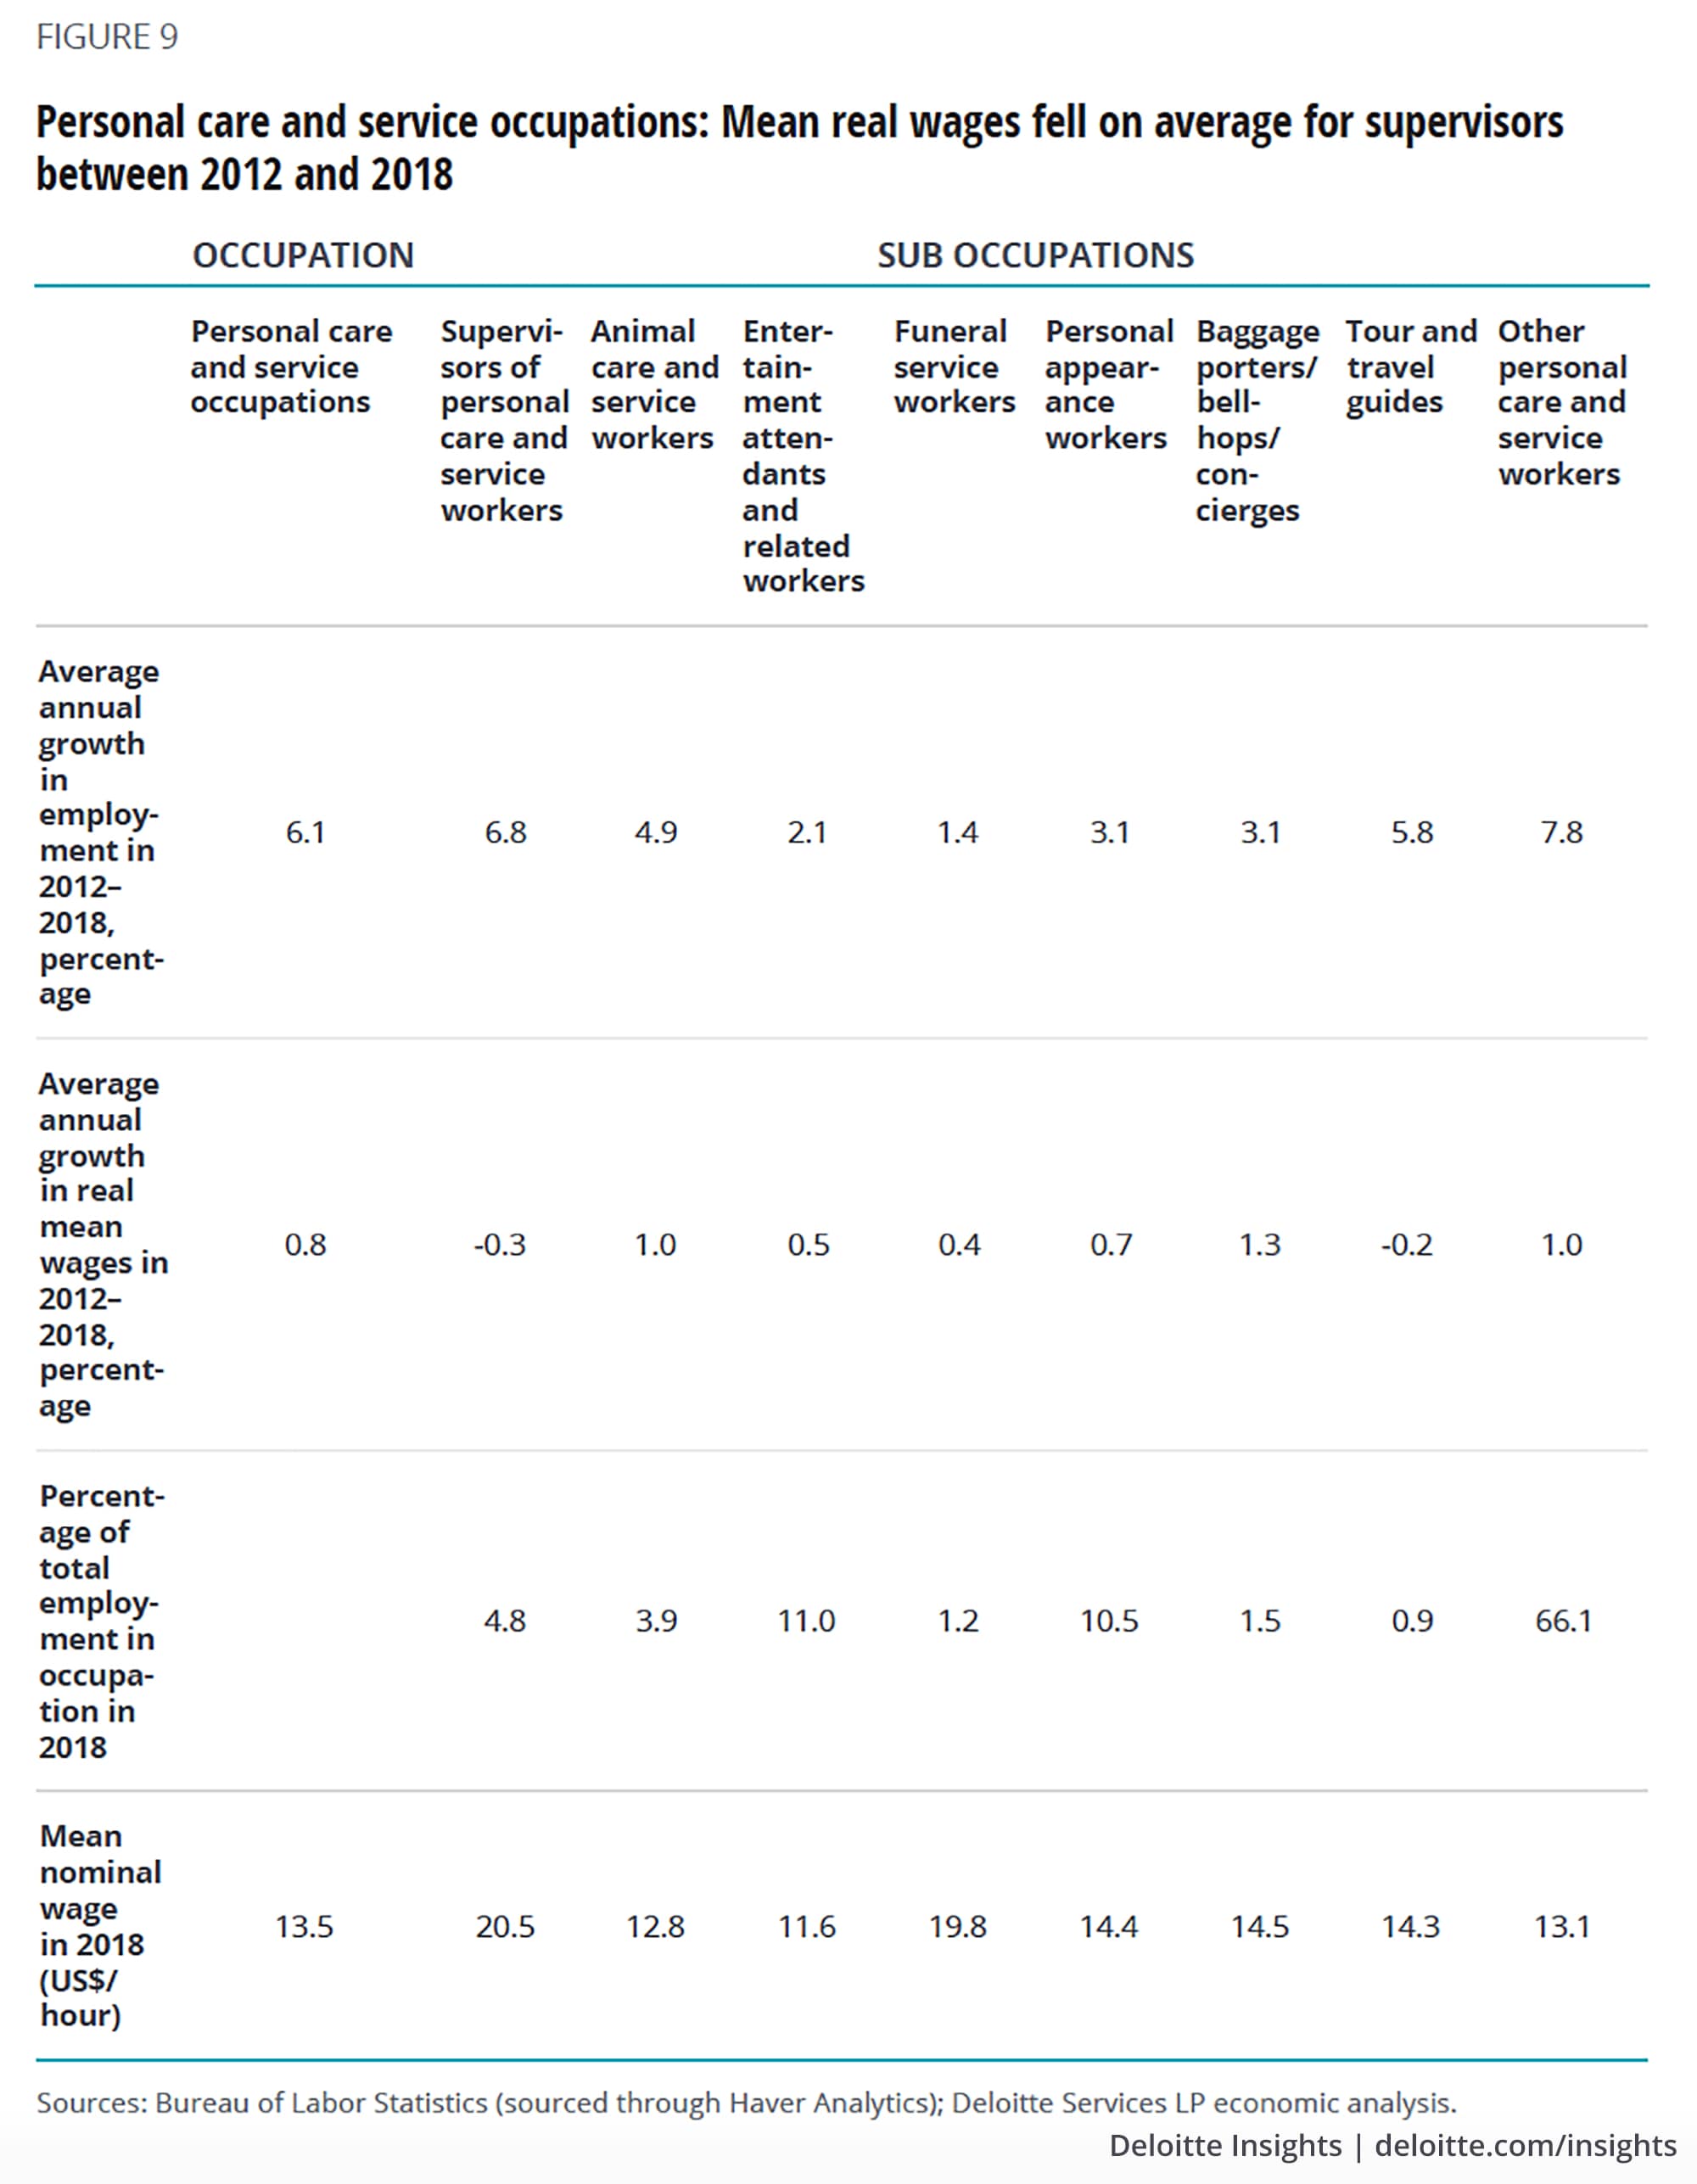
Personal care and service occupations: Entertainment attendants and related workers are the lowest paid on average (within the overall occupation) with a mean nominal wage of US$11.6 per hour in 2018. The biggest share of workers within personal care and service occupations is “other workers,” a category that includes child-care workers, personal care aides, and recreation and fitness workers, among others. As figure 9 shows, these workers on average also earn relatively low wages.
A2. Nominal wage and employment figures for occupations by wage categories
© 2021. See Terms of Use for more information.
Explore more on economics
-
Issues by the Numbers Collection
-
Global Weekly Economic Update Article2 days ago
-
US-China economic relations monthly update Article4 years ago
-
South Africa economic outlook, November 2024 Article4 months ago
-
The economic impact of COVID-19 (novel coronavirus) Article5 years ago


