
United States Economic Forecast 3rd Quarter 2020
20 minute read
14 September 2020
Late-arriving economic data has policymakers—and the rest of us—looking backward when we need to look ahead. Notwithstanding big Q3 numbers, our forecast reflects an economy that’s beginning to stall and faces a rough stretch.
Introduction: Don’t mistake your rearview mirror for the windshield
COVID-19 has challenged policymakers in all kinds of ways over the last six months—not least in the frustrating length of time between policy changes and results. For example, Gov. Andrew Cuomo issued a stay-at-home order for the state of New York on March 20, but the number of confirmed cases peaked in New York a month later, and the slow decline after meant that in early May, the number of new cases had only halved from the peak. Not until June, when the caseload was about 10% of the peak, did the state government approve the resumption of some normal activities without fearing an immediate resurgence of the virus.
Learn more
Learn how to combat COVID-19 with resilience
Explore the Economics collection
Learn about Deloitte's services
Go straight to smart. Get the Deloitte Insights app
The problem is more acute when looking at economic data. Under normal circumstances, agencies release most key economic data monthly. Right now, that’s proving too slow for policymakers to adjust in real time, and economists are experimenting with a variety of daily and weekly data sources. But just as it takes time to see the policy impact on the pandemic, it takes time to see the virus’s impact on economic activity.
Which brings us to quarterly GDP. At the end of July, the government announced that GDP had fallen by a record amount in the second quarter.1 At that point, the economy had actually begun to recover. The lag in publishing GDP—and the quarterly estimation period—had us looking in a rearview mirror and reading about a huge decrease when more recent data told us a different story.
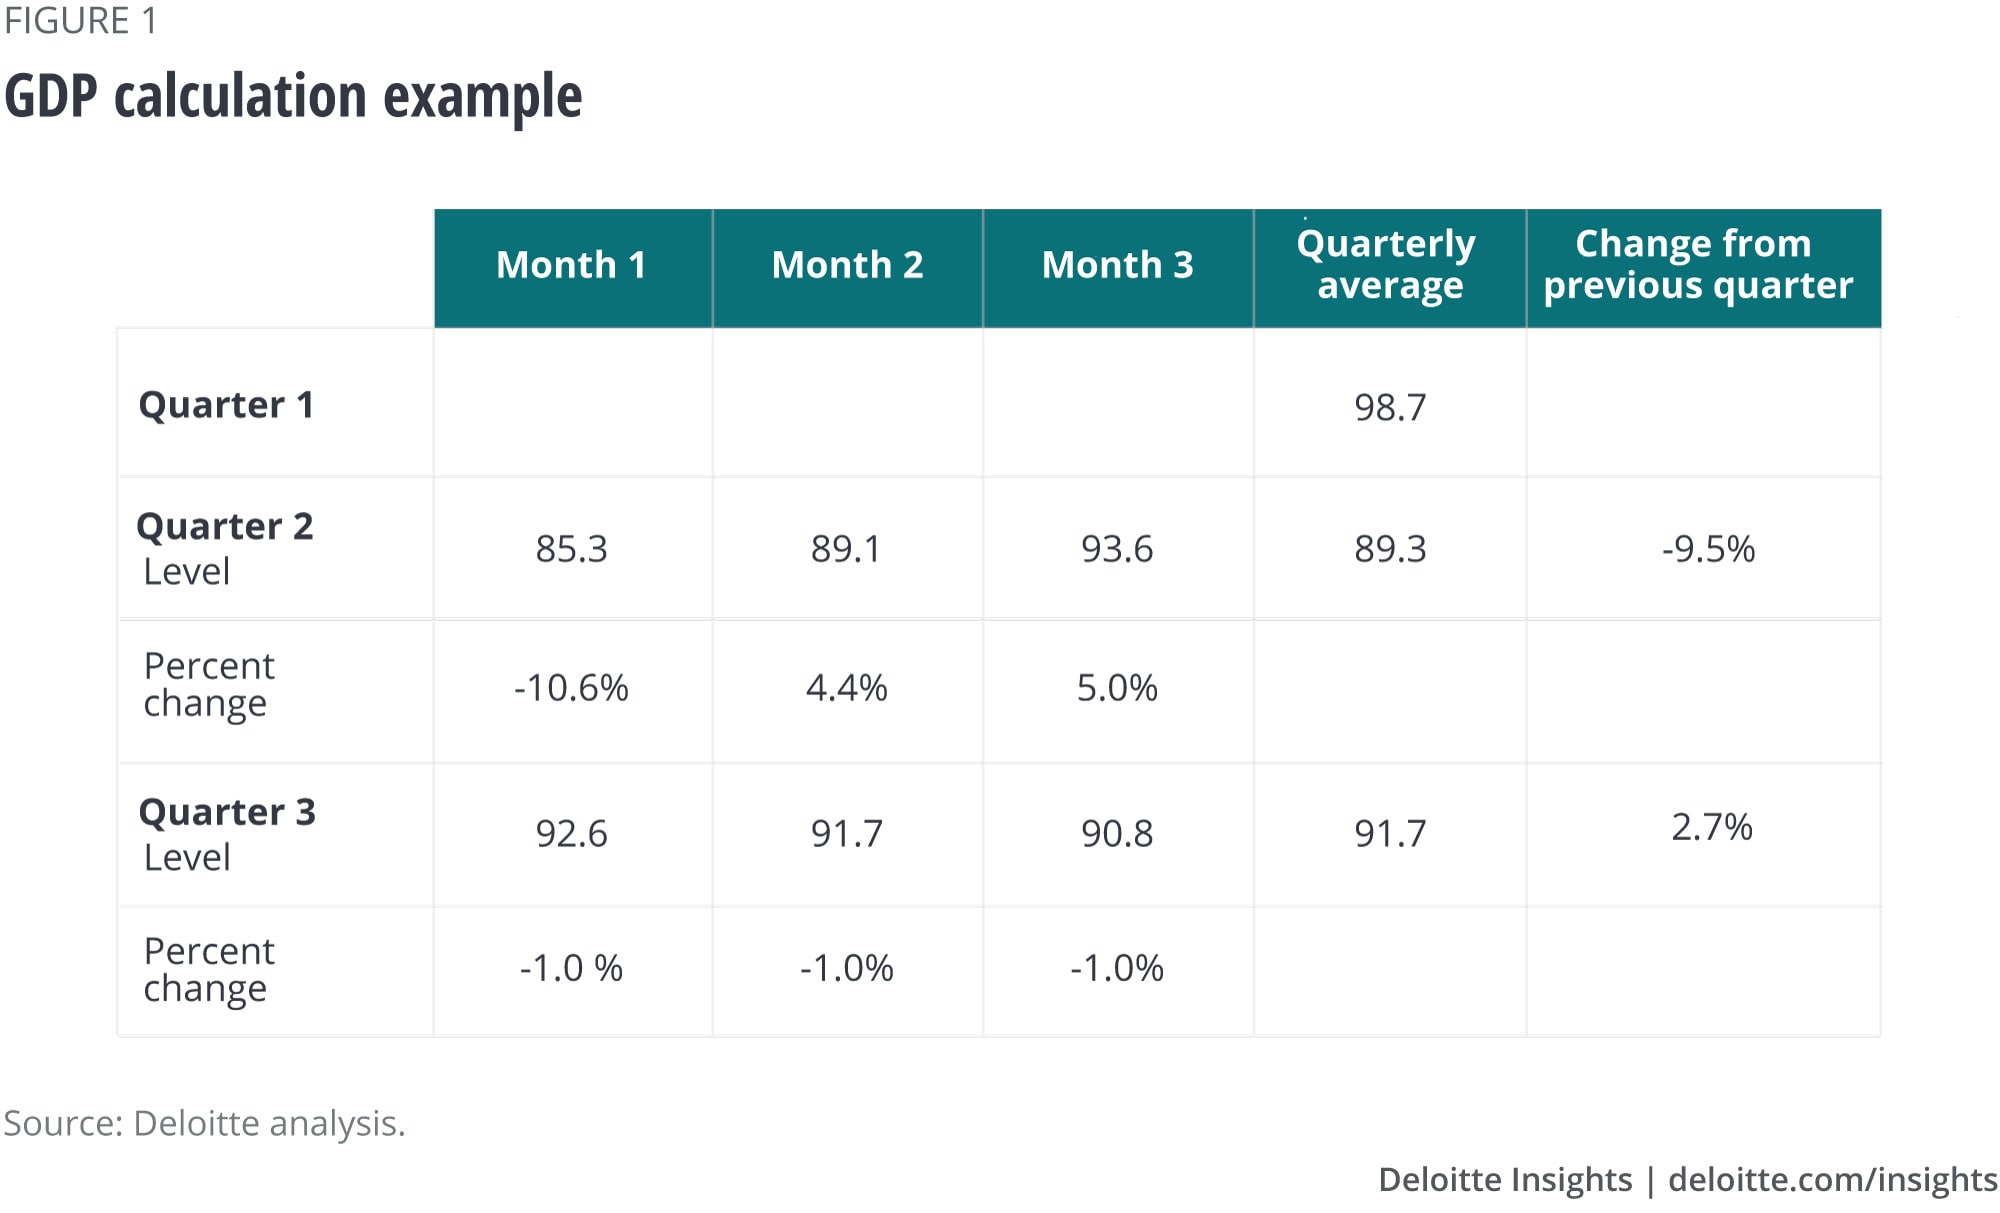
Unfortunately, that problem is about to worsen—in the opposite direction. There are signs that the economy is stalling as COVID cases rose nationally through the late spring and well into the summer. The first reading of third-quarter GDP will appear in October, and arithmetic indicates that it will show a huge growth rate—even if the economy falls in all three months of the quarter. (See sidebar, “The arithmetic of quarterly GDP growth.”)
And the slowing economy faces further pressures from Congress’s failure to pass a fourth relief act, which—at least in the short term—eliminated the US$600 supplement for unemployment insurance and failed to provide funding for state and local governments facing unexpectedly huge deficits.
First, we calculate that the US$600 supplement accounted for about 4.5% of all personal income in June. The standard unemployment insurance provides a surprisingly small replacement for income—about 40% to 45% on average for the country as a whole, and much less in some states2—and the supplement’s elimination means that personal income declined substantially in August, with a likely corresponding hit to consumer spending and the economy.
Second, state and local tax revenues have, unsurprisingly, dropped substantially. New York state tax collections were down 17% in June 2020 compared to June 20193 while Florida revenues came in 5.7% below plan in the fiscal year that ended in June,4 and they’re hardly exceptional: Every state is struggling. State governments are not allowed to run deficits, and the federal government—which can—has the ability to provide a bridge for state and local funding to prevent drastic cuts in spending. But Congress left that on the table when it failed to agree on another relief act, and the result is likely to be drastic spending cuts and significant layoffs of state and local employees. Worse, expenses are up, particularly in schools. With federal assistance in doubt, state and local governments will have to find the money to fund schools, and the rest of their budgets is the only place to go.
These two factors are key to the short-term outlook in our baseline. We assume that the sudden drop in unemployment insurance payments has the expected impact on consumer spending and GDP in August and September. We also assume that state and local governments begin a process of cutting spending about 10% through 2021, although we (optimistically) assume that the federal government does pass a funding bill that allows this to reverse through 2022. Both of these are very significant drags on growth in the short run.
We still assume that a vaccine and/or treatment will allow normal economic activity to begin to resume in mid-2021. As it will take time to deploy the vaccine (and the first vaccine to market is unlikely to be 100% effective), we expect growth to remain somewhat constrained for the next few years. Nevertheless, we do see the economy reaching full employment before the end of the forecast horizon. But—and it’s an important but—the economy will never regain the pre-COVID trend line. Potential GDP and productivity growth are likely to be constrained by the need to adjust to changes in consumer behavior and businesses’ desire to rebuild supply chains to be more robust.
Smart observers will ignore the pleasant scene in the rearview mirror. What matters now is what we see through the windshield. It looks like some heavy traffic ahead, and we can only hope to manage to navigate it safely.
The arithmetic of quarterly GDP changes
The US Bureau of Economic Analysis (BEA) estimates GDP on a quarterly basis. Although the BEA’s basic estimates are for the level of production, it’s the change from the previous quarter that everybody pays attention to. And the monthly pattern can make a big difference in the reported change in GDP.
Figure 1 shows an example based on recent data. Information provider IHS Markit estimates monthly GDP, which is displayed in figure 1 in index form, with January 2020 equaling 100. GDP fell so far in April, the first month of Q2, that—despite growth in May and June—the average level of GDP for the quarter remained substantially below the average level in the first quarter. The figures for the third quarter are estimates consistent with the Deloitte quarterly forecast. Notice that GDP falls in all three months of Q3 (July, August, and September), but the average level of GDP in Q3 is still 2.7% above that in Q2.
Even more confusing, that 2.7% figure (or whatever the actual number turns out to be) will be announced on October 29. By then, economists will already have quite a bit of data, such as industrial production and retail sales, showing the decline in activity over the preceding months. The GDP number won’t be wrong—it will just be out of date. Users should watch out for this when interpreting the latest press release or political ad.
Scenarios
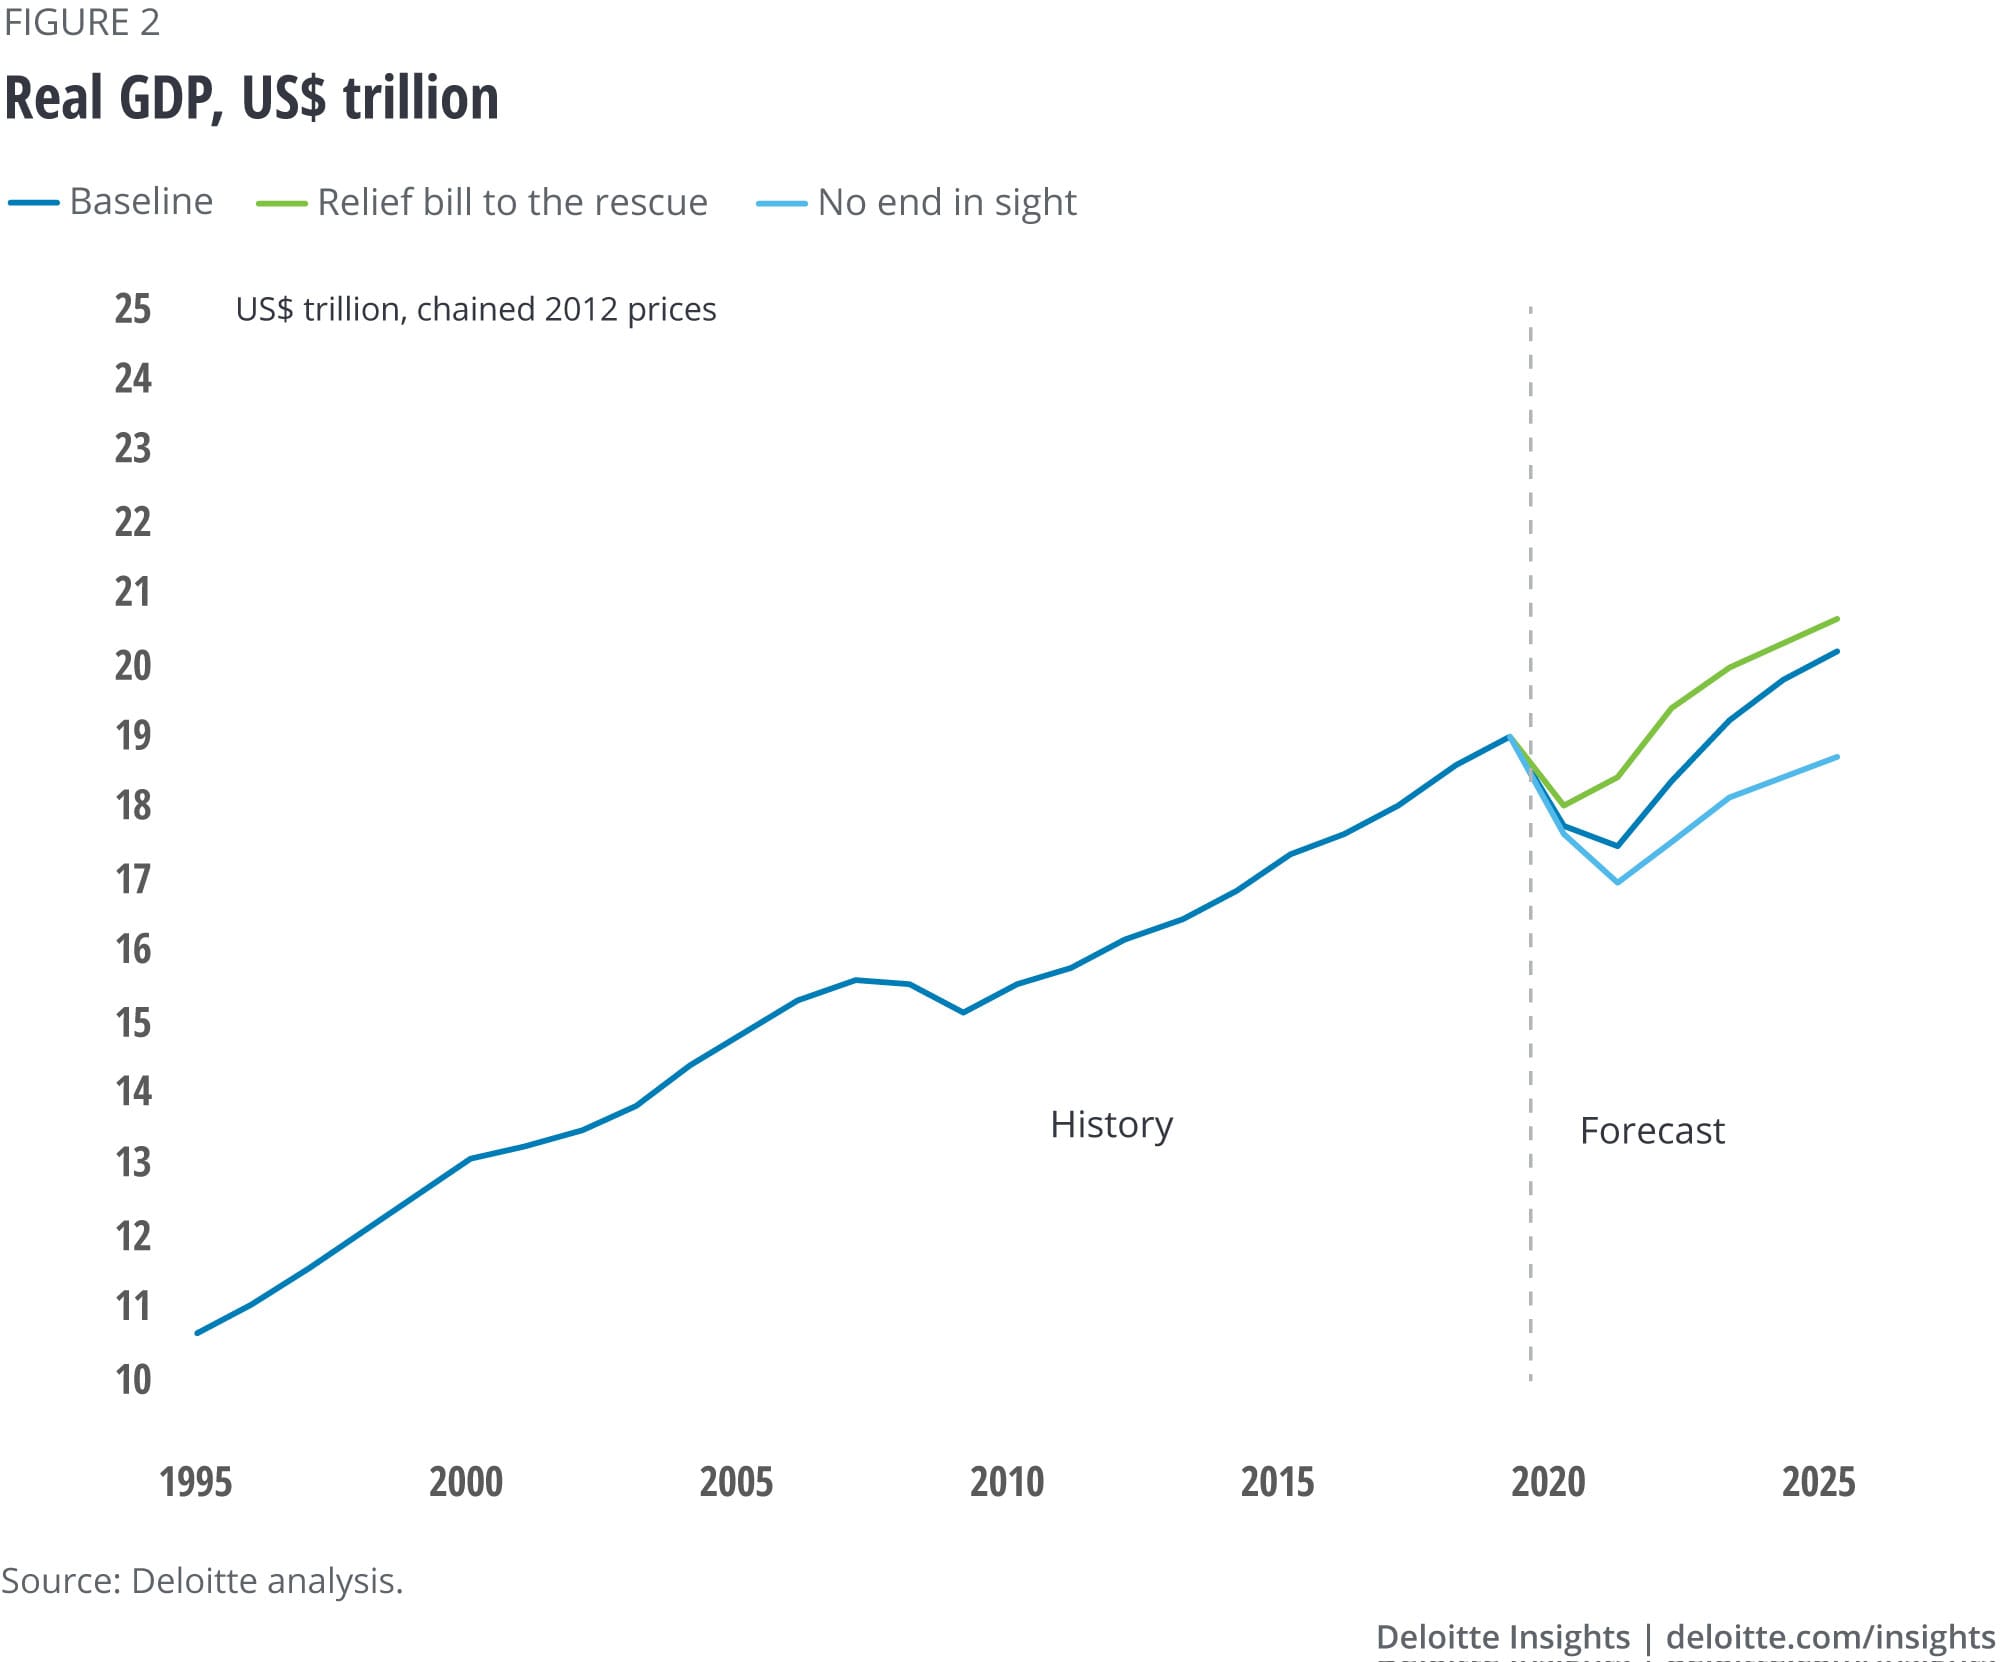
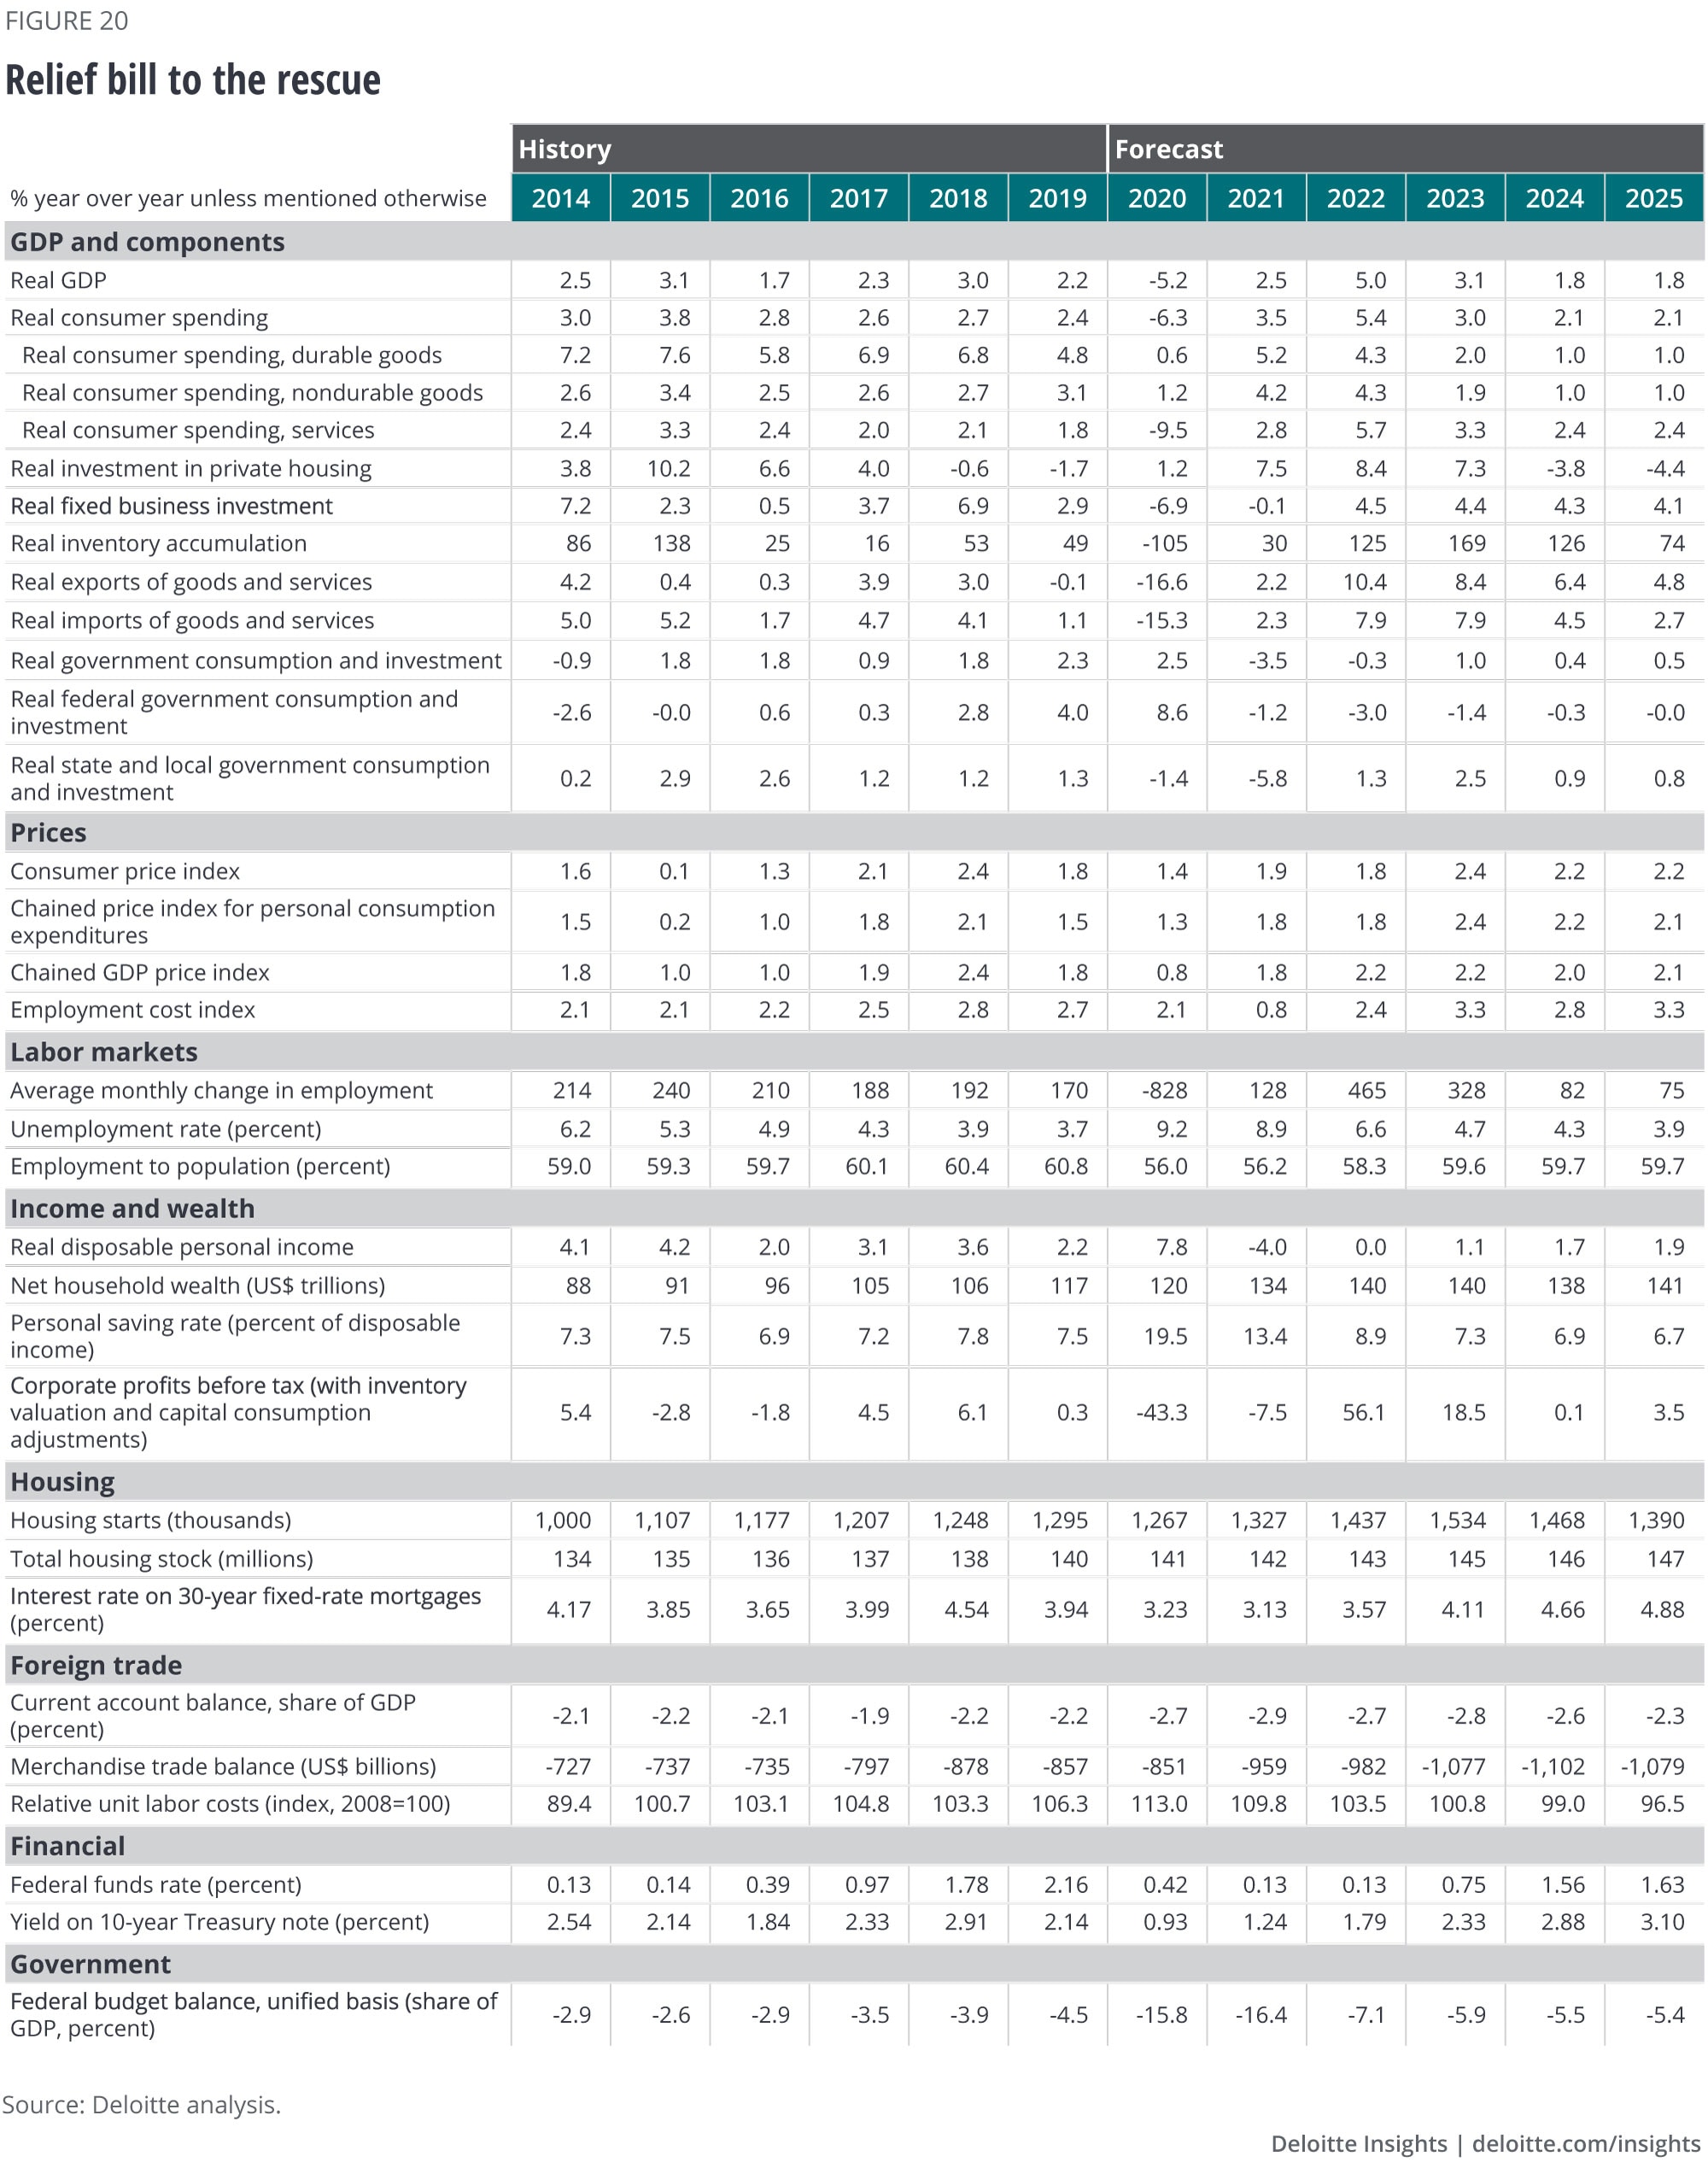
Relief bill to the rescue (20%): Congressional negotiations for additional relief succeed during Q3. Most of the lost personal income from the withdrawal of the US$600 unemployment insurance supplement is replaced, and the federal government provides resources to state and local governments, and especially to schools. Personal spending picks up in September, and state and local spending remains steady. Schools are able to provide enough coverage to enable people to return to work, and workers in areas with virtual schools are generally successful in finding solutions to their childcare problems. In late 2020, a successful vaccine trial lifts business and consumer confidence, although restrictions remain for six to 12 months in some places as the vaccine is deployed. By late 2021, most health restrictions have been removed, and the earlier federal action to provide financing to the private sector bears fruit, as many companies are able to quickly resume operating at former levels.
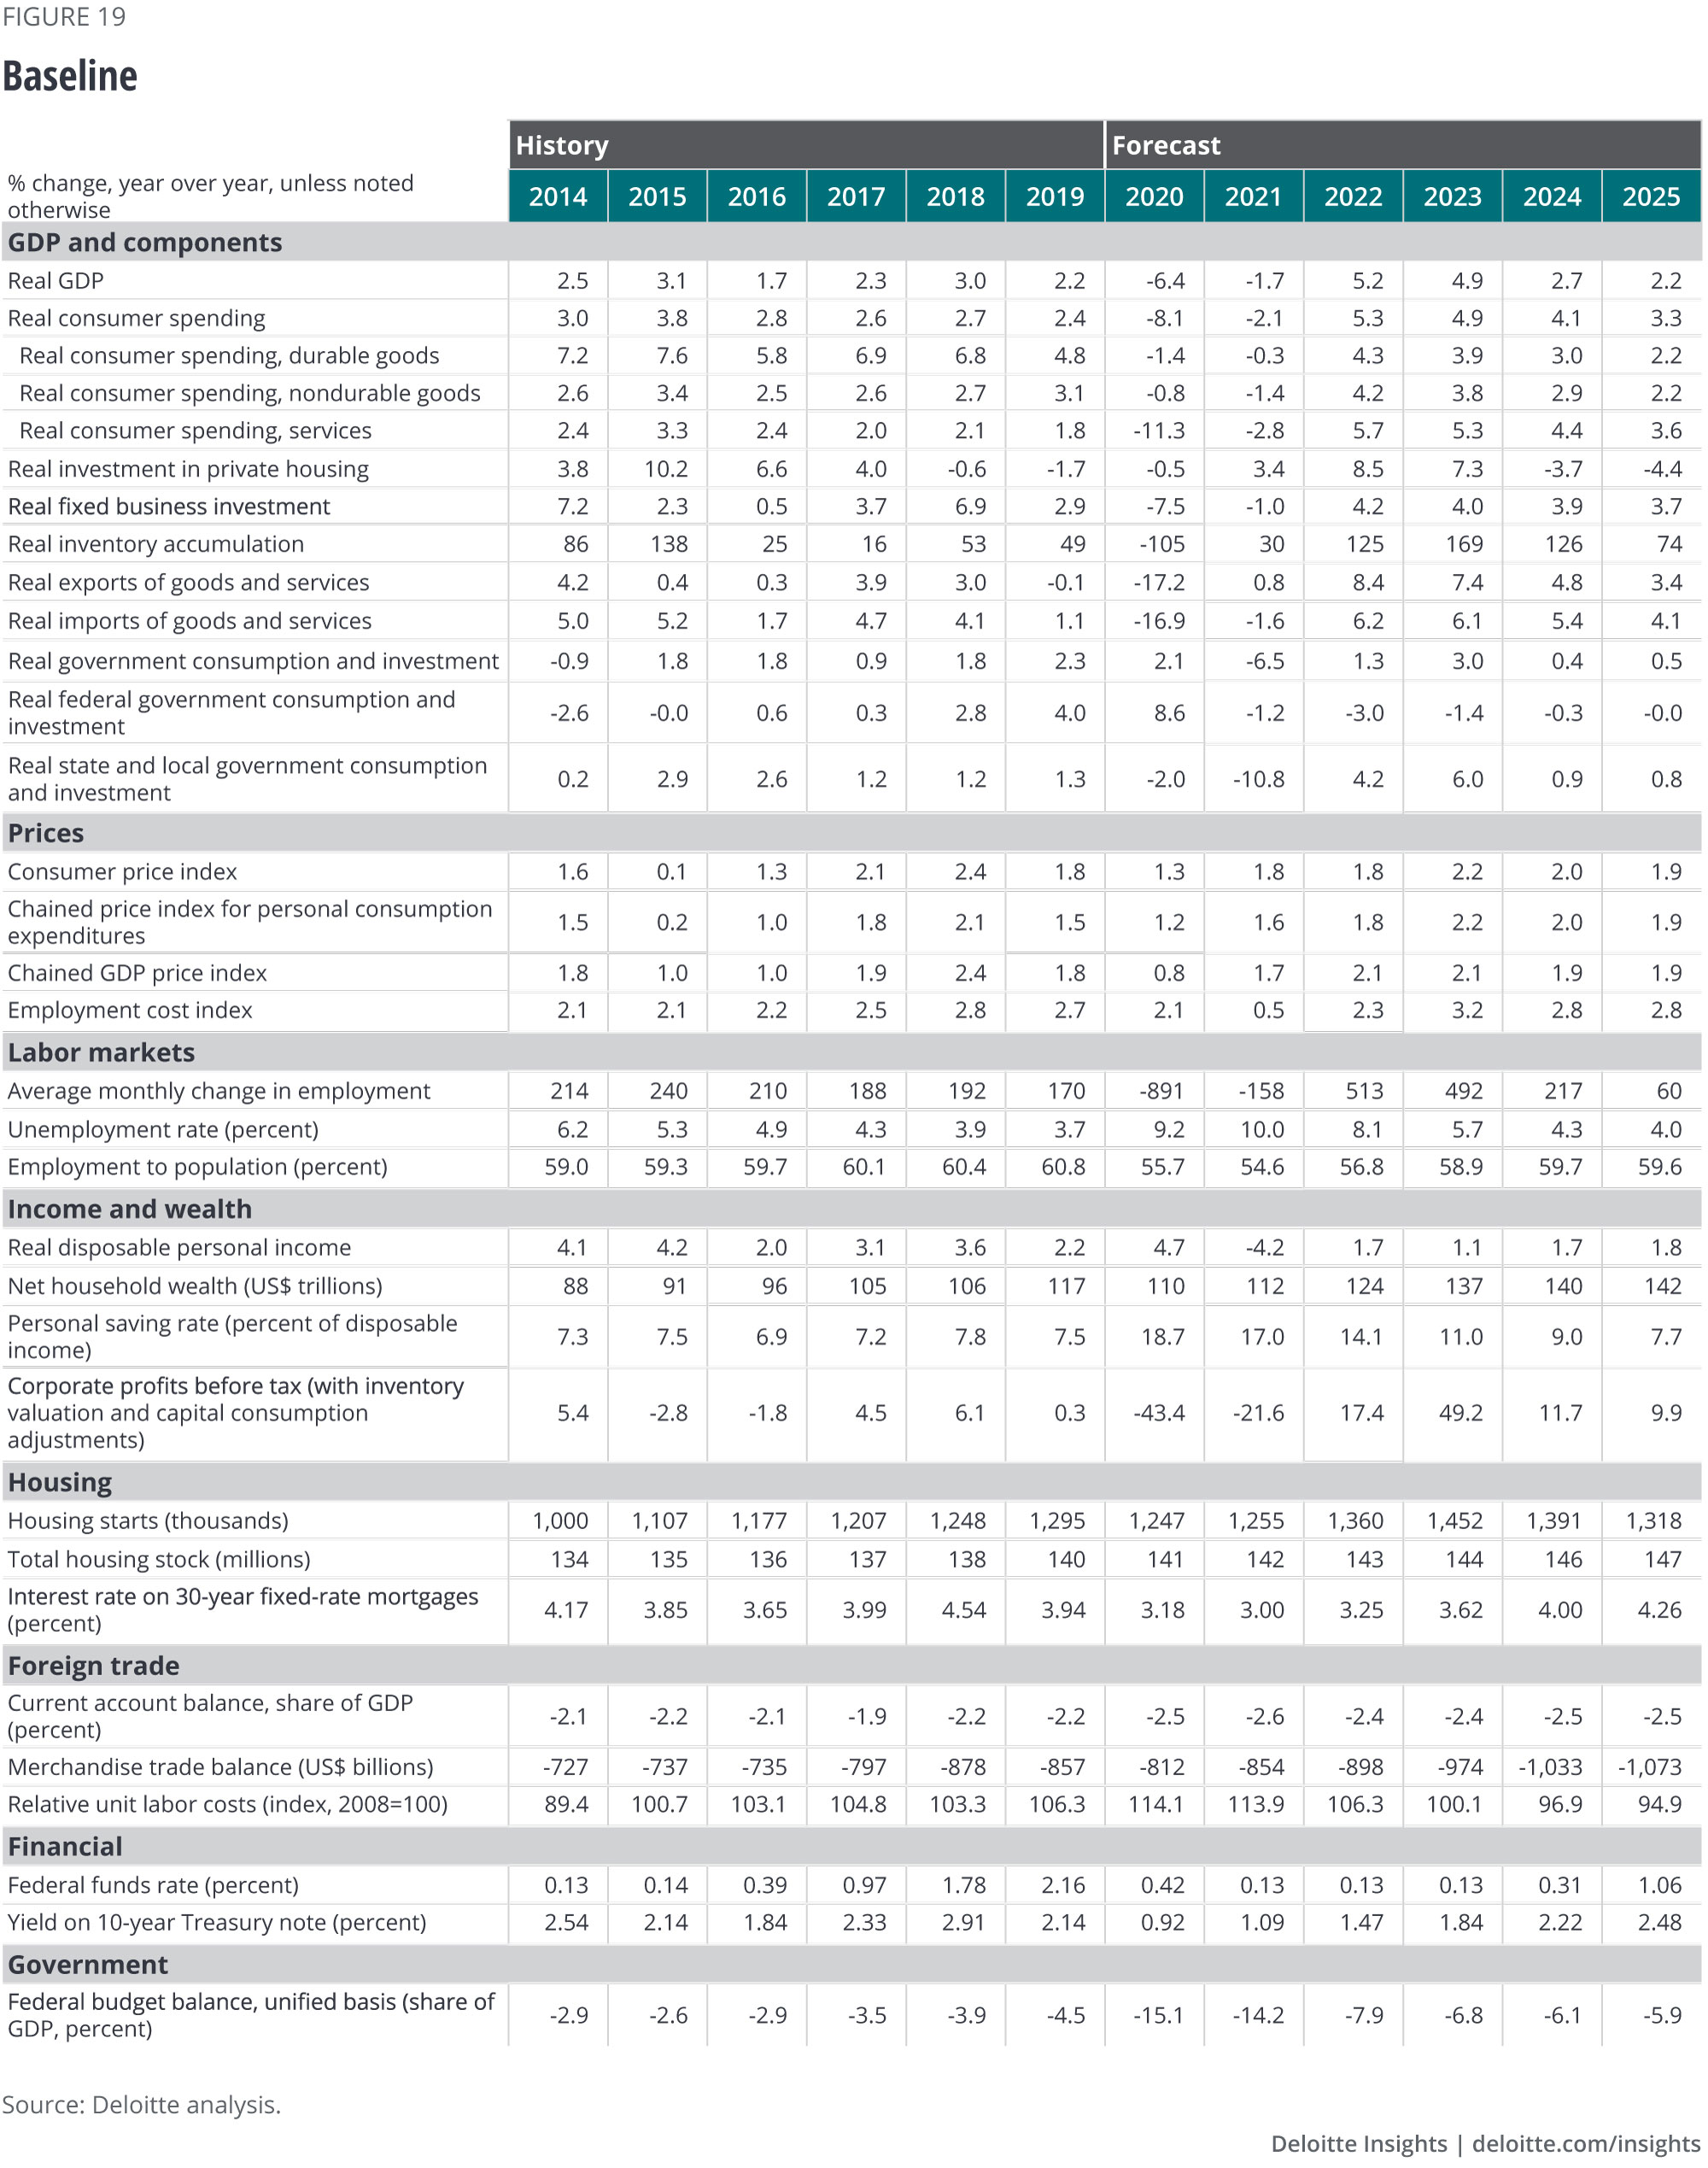
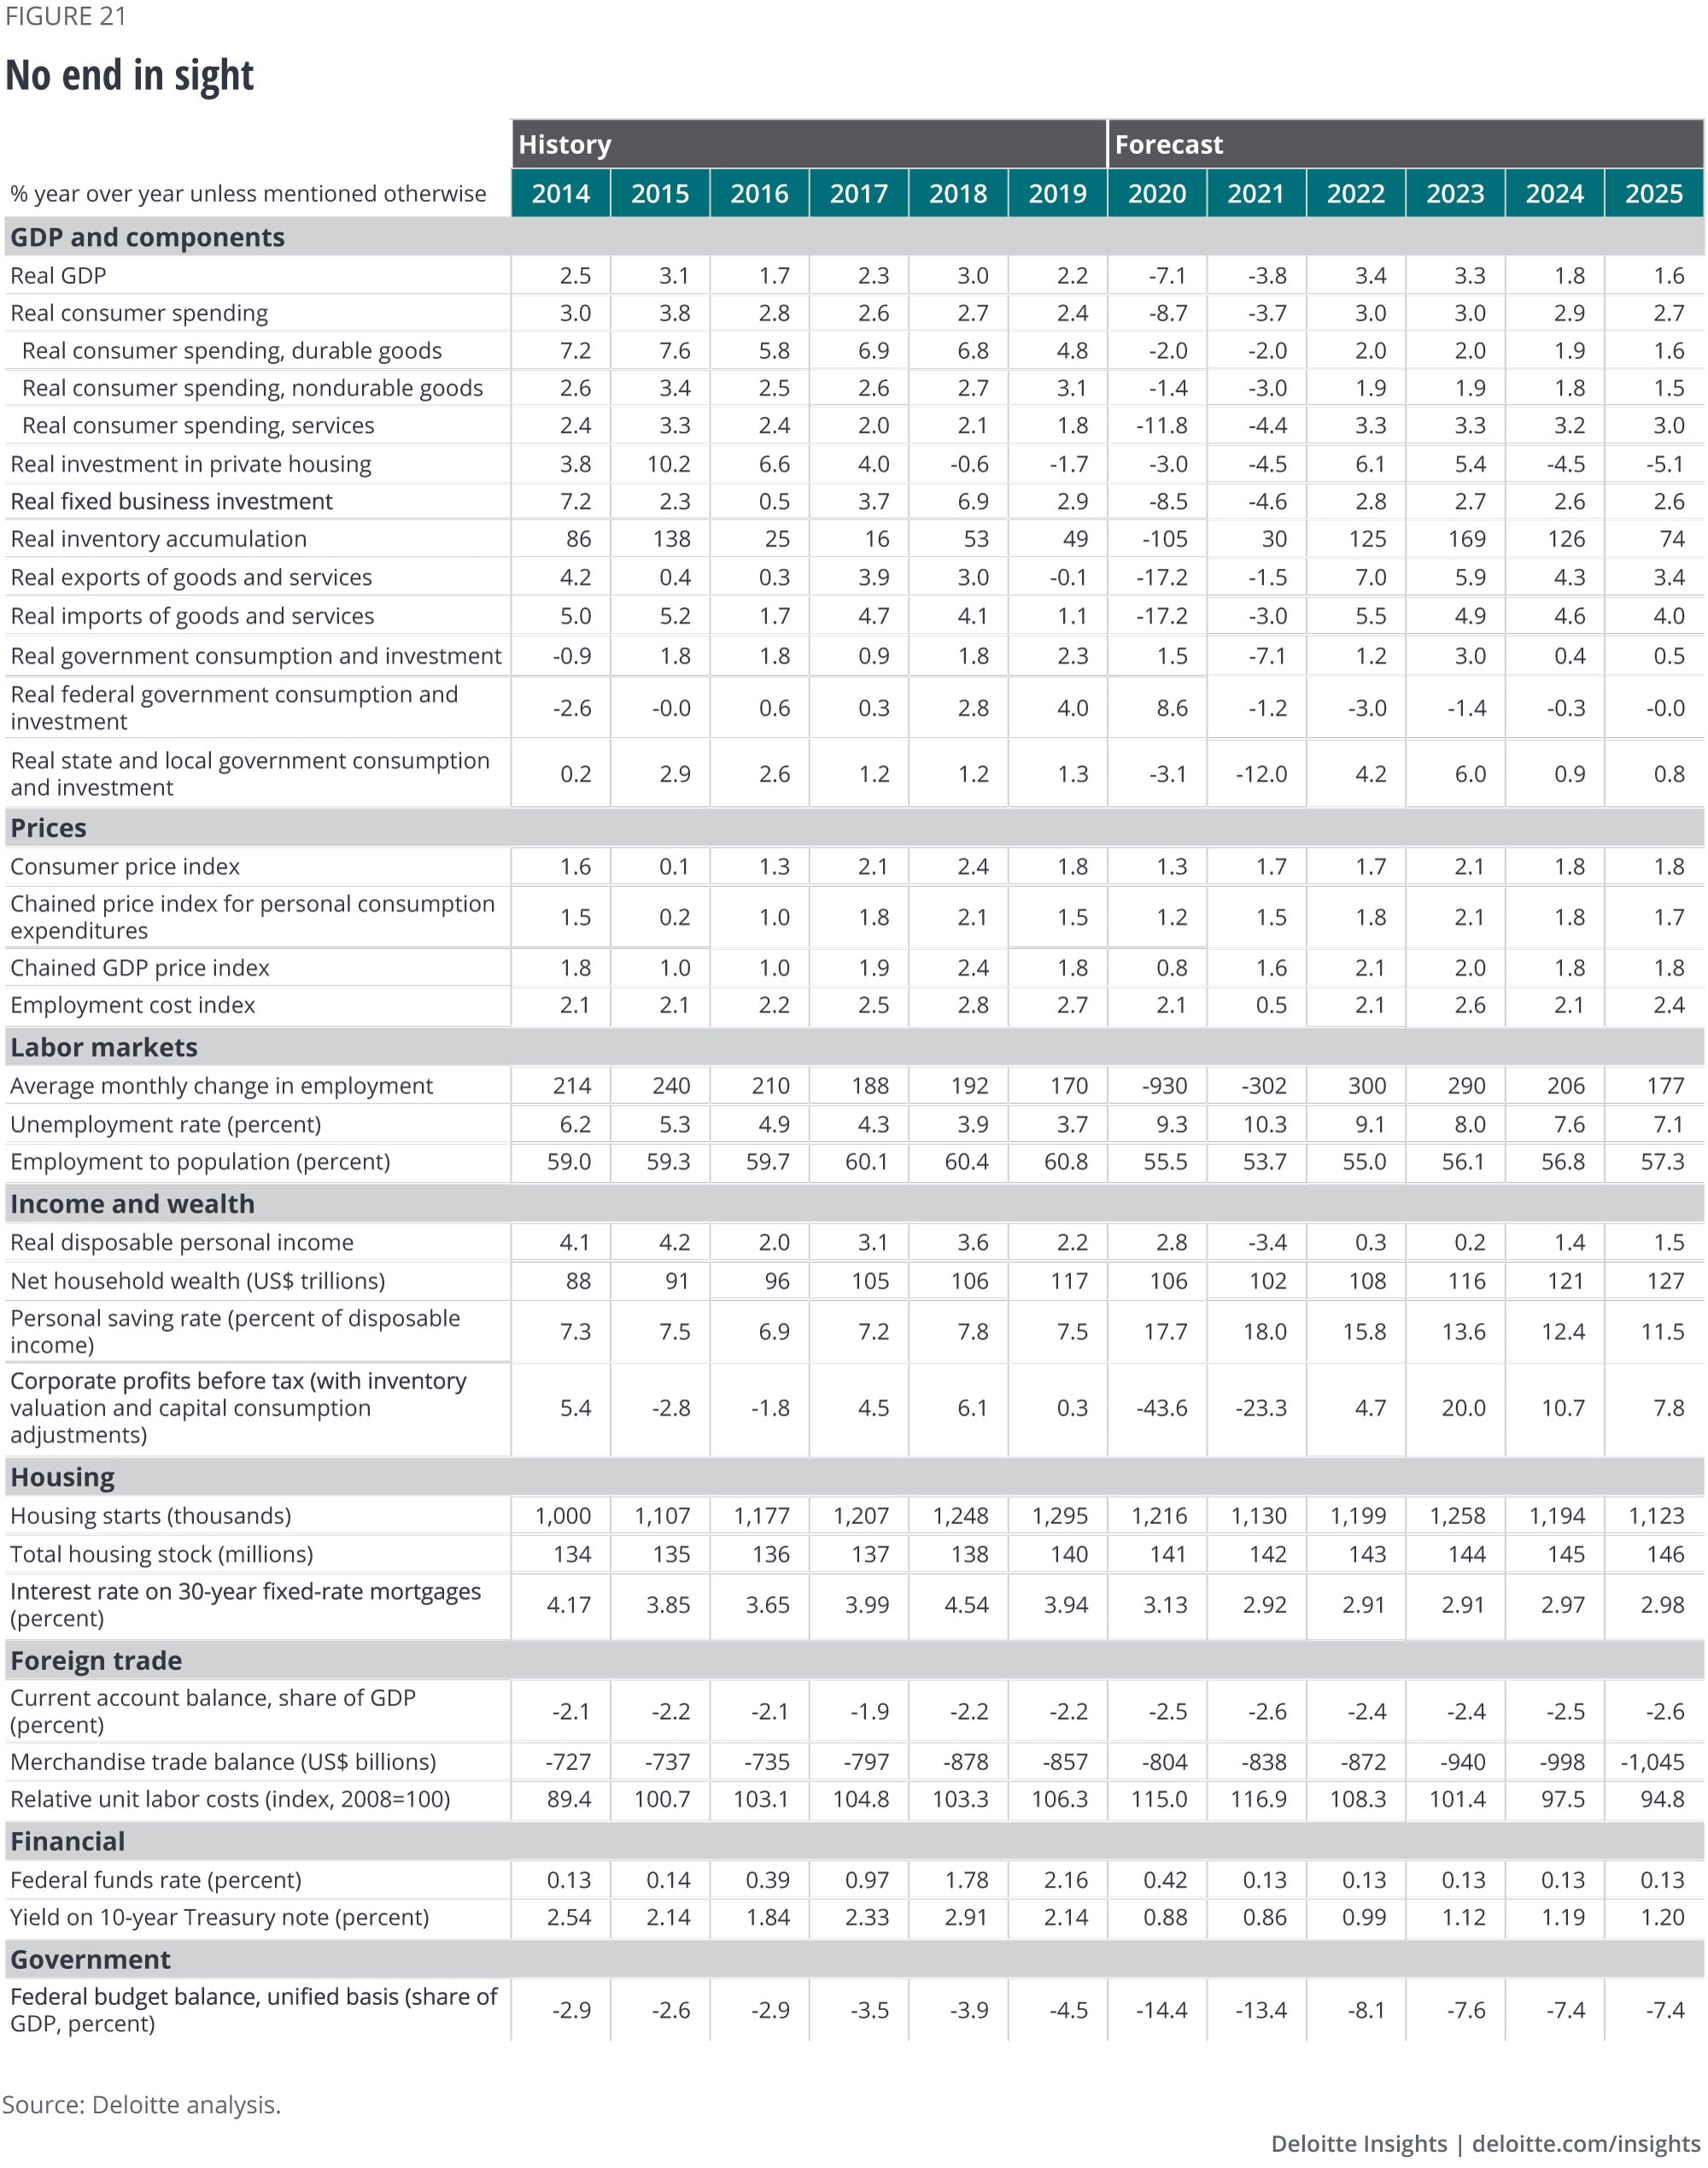
Baseline (55%): The lack of a fourth relief package has a significant impact on US GDP. Both consumer spending and state and local government spending fall substantially beginning in August. Overall demand falls and, later in the year, is at best flat. Schools turning to virtual learning pulls potential workers (especially women) out of the labor force, so the unemployment rate spikes less than expected. However, the economy remains weak until deployment of a vaccine in early 2021 creates conditions for improvement. Since deployment takes time, the economy does not see significant growth until the middle of 2021. Growth then picks up speed, although potential growth remains lower than the pre-pandemic level.
No end in sight (25%): COVID-19 cases remain high for the rest of this year, and states are forced to attempt to again limit economic activity. Schools meet virtually, and some parents leave the labor force to manage their children’s schooling. The lack of either treatment or an effective vaccine means that the cycle of restart attempts and subsequent reclosing continues. This limits the possibility of recovery and erodes trust in institutions; even as treatment improves and businesses again reopen, consumers prefer to stay at home in safety rather than take what they have come to believe are unwarranted risks. One quarter of faster growth, in 2020 Q3, is offset by a decline in 2020 Q4 due to fresh outbreaks in the fall and the lack of policy response. After that, the recovery is hesitant and GDP growth remains relatively slow. By 2025, unemployment remains in double digits, with the level of GDP over 10% below the level it would have reached had the pandemic not occurred.
Sectors
Consumer spending
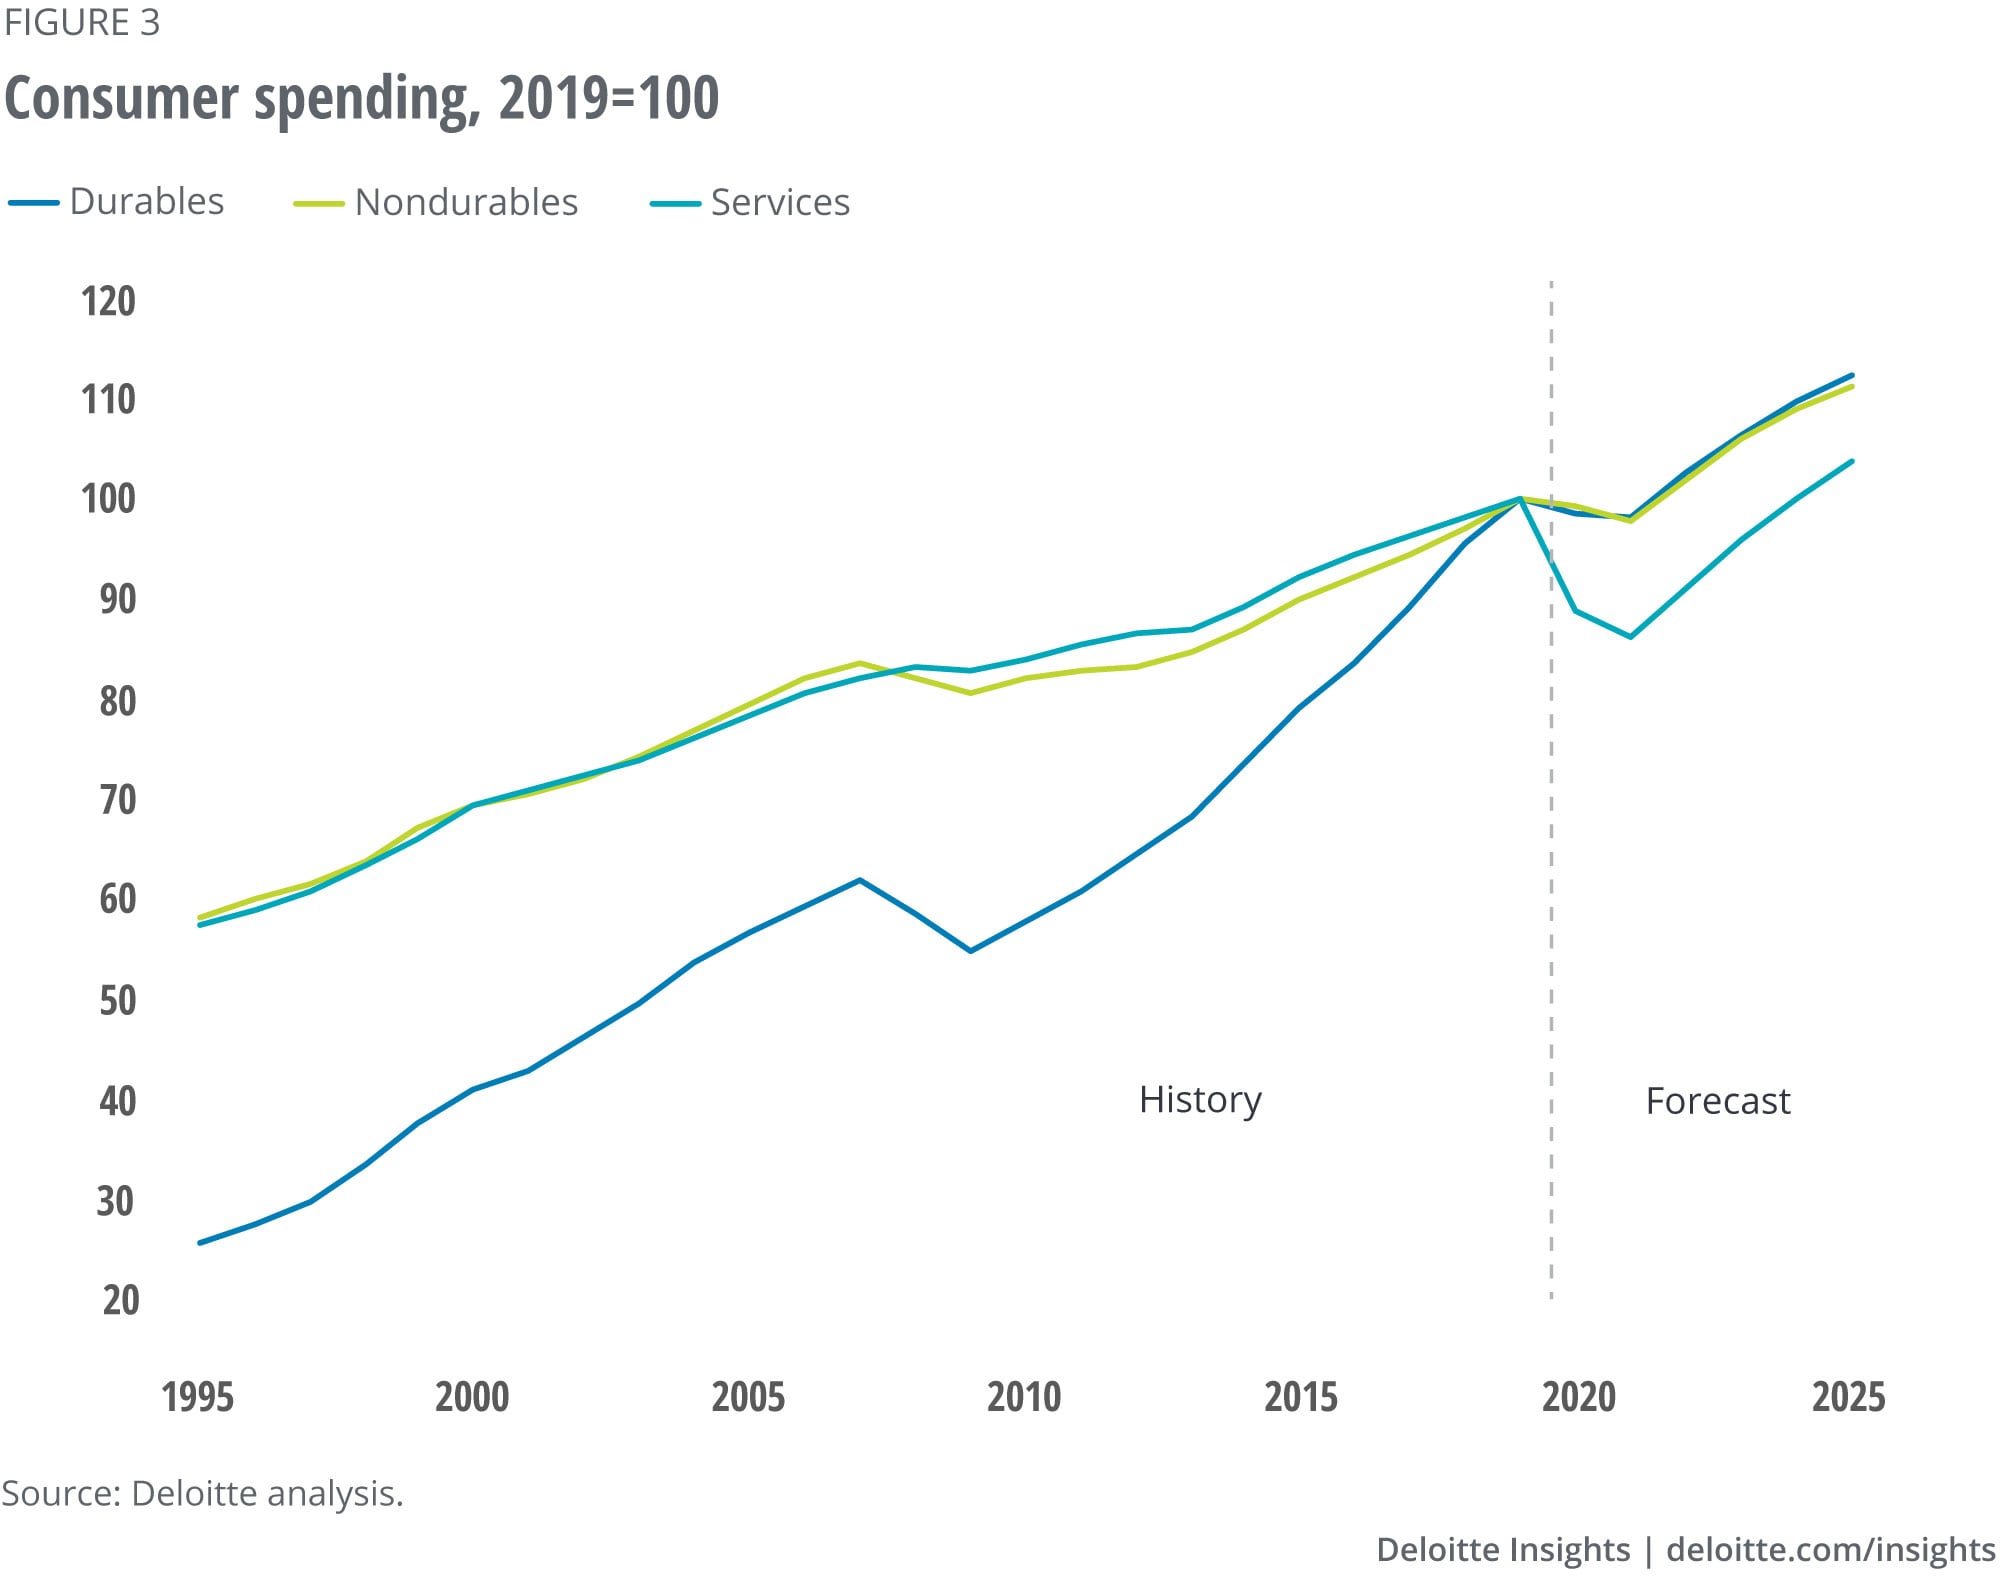
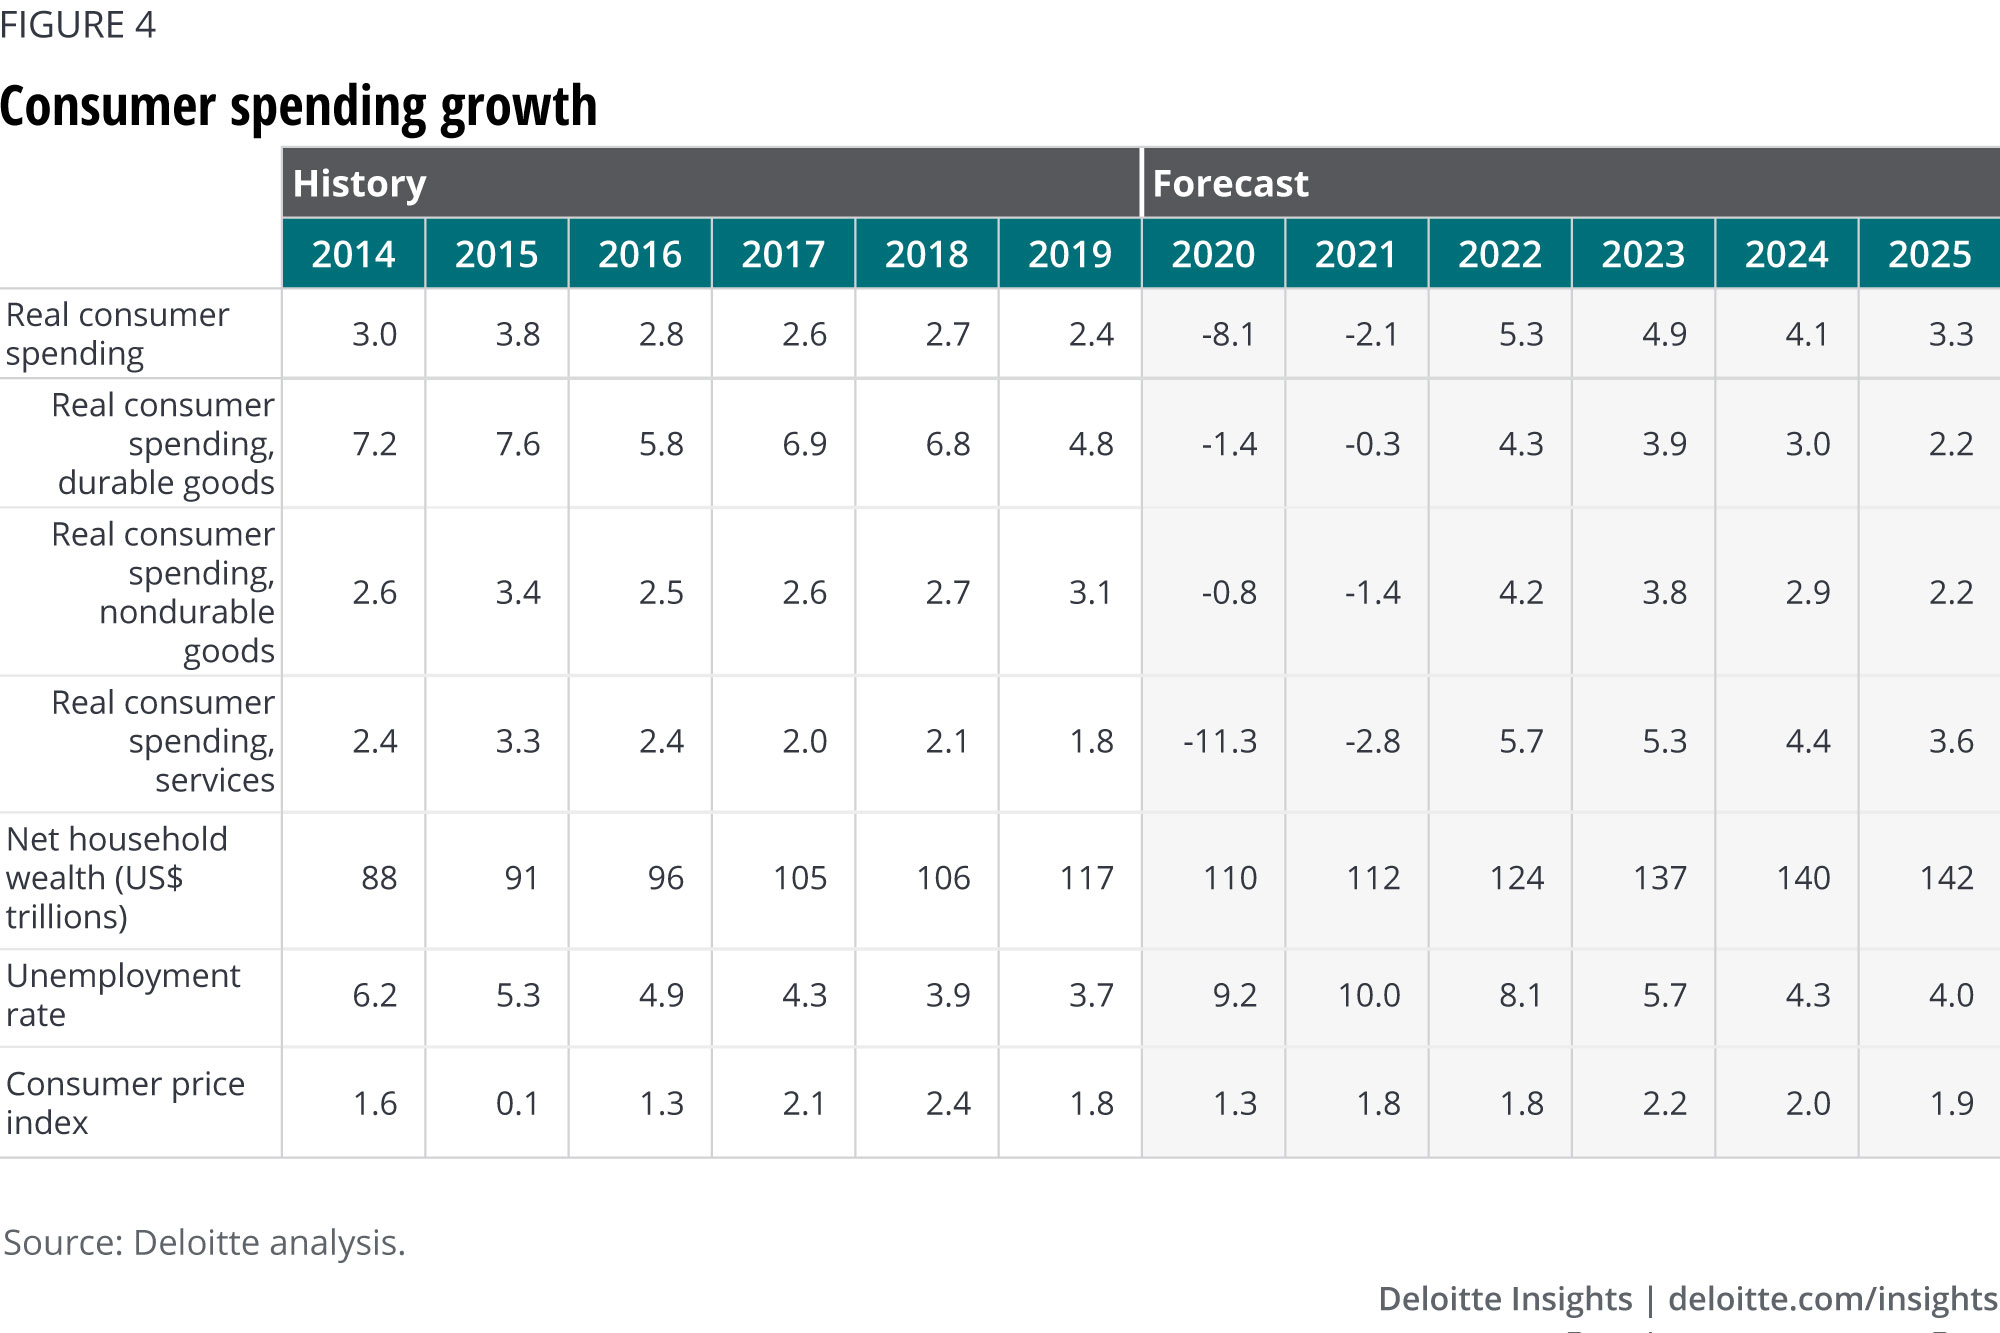
The late spring saw a jump in retail sales and consumer spending as state and local governments relaxed rules to fight the COVID-19 pandemic. One reason why consumers were able to spend: money from the US government. A large share of households that experienced job loss received enhanced unemployment payments of US$600 per week, a substantial amount considering that the average weekly benefit was only US$377 in the fourth quarter of 2019.5 By some estimates, as many as two-thirds of laid-off workers received more money than they earned before they were laid off.6 In addition, the US government sent pandemic stimulus checks to households under certain income thresholds. The result: Disposable personal income was 6.1% higher in June than in February despite a massive increase in unemployment.
Income from employment has been growing since businesses began rehiring workers laid off in the spring. But it can’t fill the income hole left by the pandemic. Those US$600 stimulus checks stopped when August started—one consequence of the inability of Congress and the president to agree on a fourth relief bill. We estimate that those checks accounted for as much as 4.5% of personal income in June, so many households will suddenly find themselves pinched come August and September. Even though the Trump administration is attempting to replace some of this money through administrative means, the total amount of additional income from this is likely to be limited.7
That creates a serious concern—that spending will take a dive in August and September. We’ve incorporated an implied decline in consumer spending (and GDP) in those months, to reflect this. And on top of the loss of income, a number of states have reinstated some limitations on movement and activities as COVID-19 outbreaks continue.
The result is likely to be a decline in spending starting in July or August, and continuing through the fall. That decline won’t prevent the average level of consumer spending in the third quarter to be higher than in the second quarter (see the sidebar above), but it will drag down activity month by month. Quarterly consumer spending and GDP data will only decline in the fourth quarter, however.
Even beyond this problem, consumer spending is unlikely to return quickly to pre-COVID levels. Consumers will need to be able to trust that going out to spend money won’t come at the risk of catching the disease. The absence of effective treatments or a vaccine could continue to dissuade many consumers from returning to restaurants, entertainment venues, or even stores. And their eventual return will likely require expensive adjustments to building infrastructure, with facilities able to serve fewer consumers.8
And on what will consumers want to spend money? Until medical interventions render considerations about the disease moot, spending will very likely shift away from activities that consumers perceive as risky—entertainment, food service, accommodation—and toward consumption that can take place in a socially distanced way.
In the longer term, the pandemic is expected to exacerbate existing consumer problems. It has thrown the problem of inequality into sharp relief, as the disease strains the budgets and living situations of millions of lower-income households. These are the very people who are less likely to have health insurance—especially after layoffs—and more likely to have health conditions that complicate recovery from COVID-19. And retirement remains a significant issue: Even before the crisis, fewer than four in 10 nonretired adults thought their retirement was on track, with one-quarter of nonretired adults saying they have no retirement savings.9 Low interest rates and a still-shaky stock market will worsen Americans’ preparation for retirement.
Housing
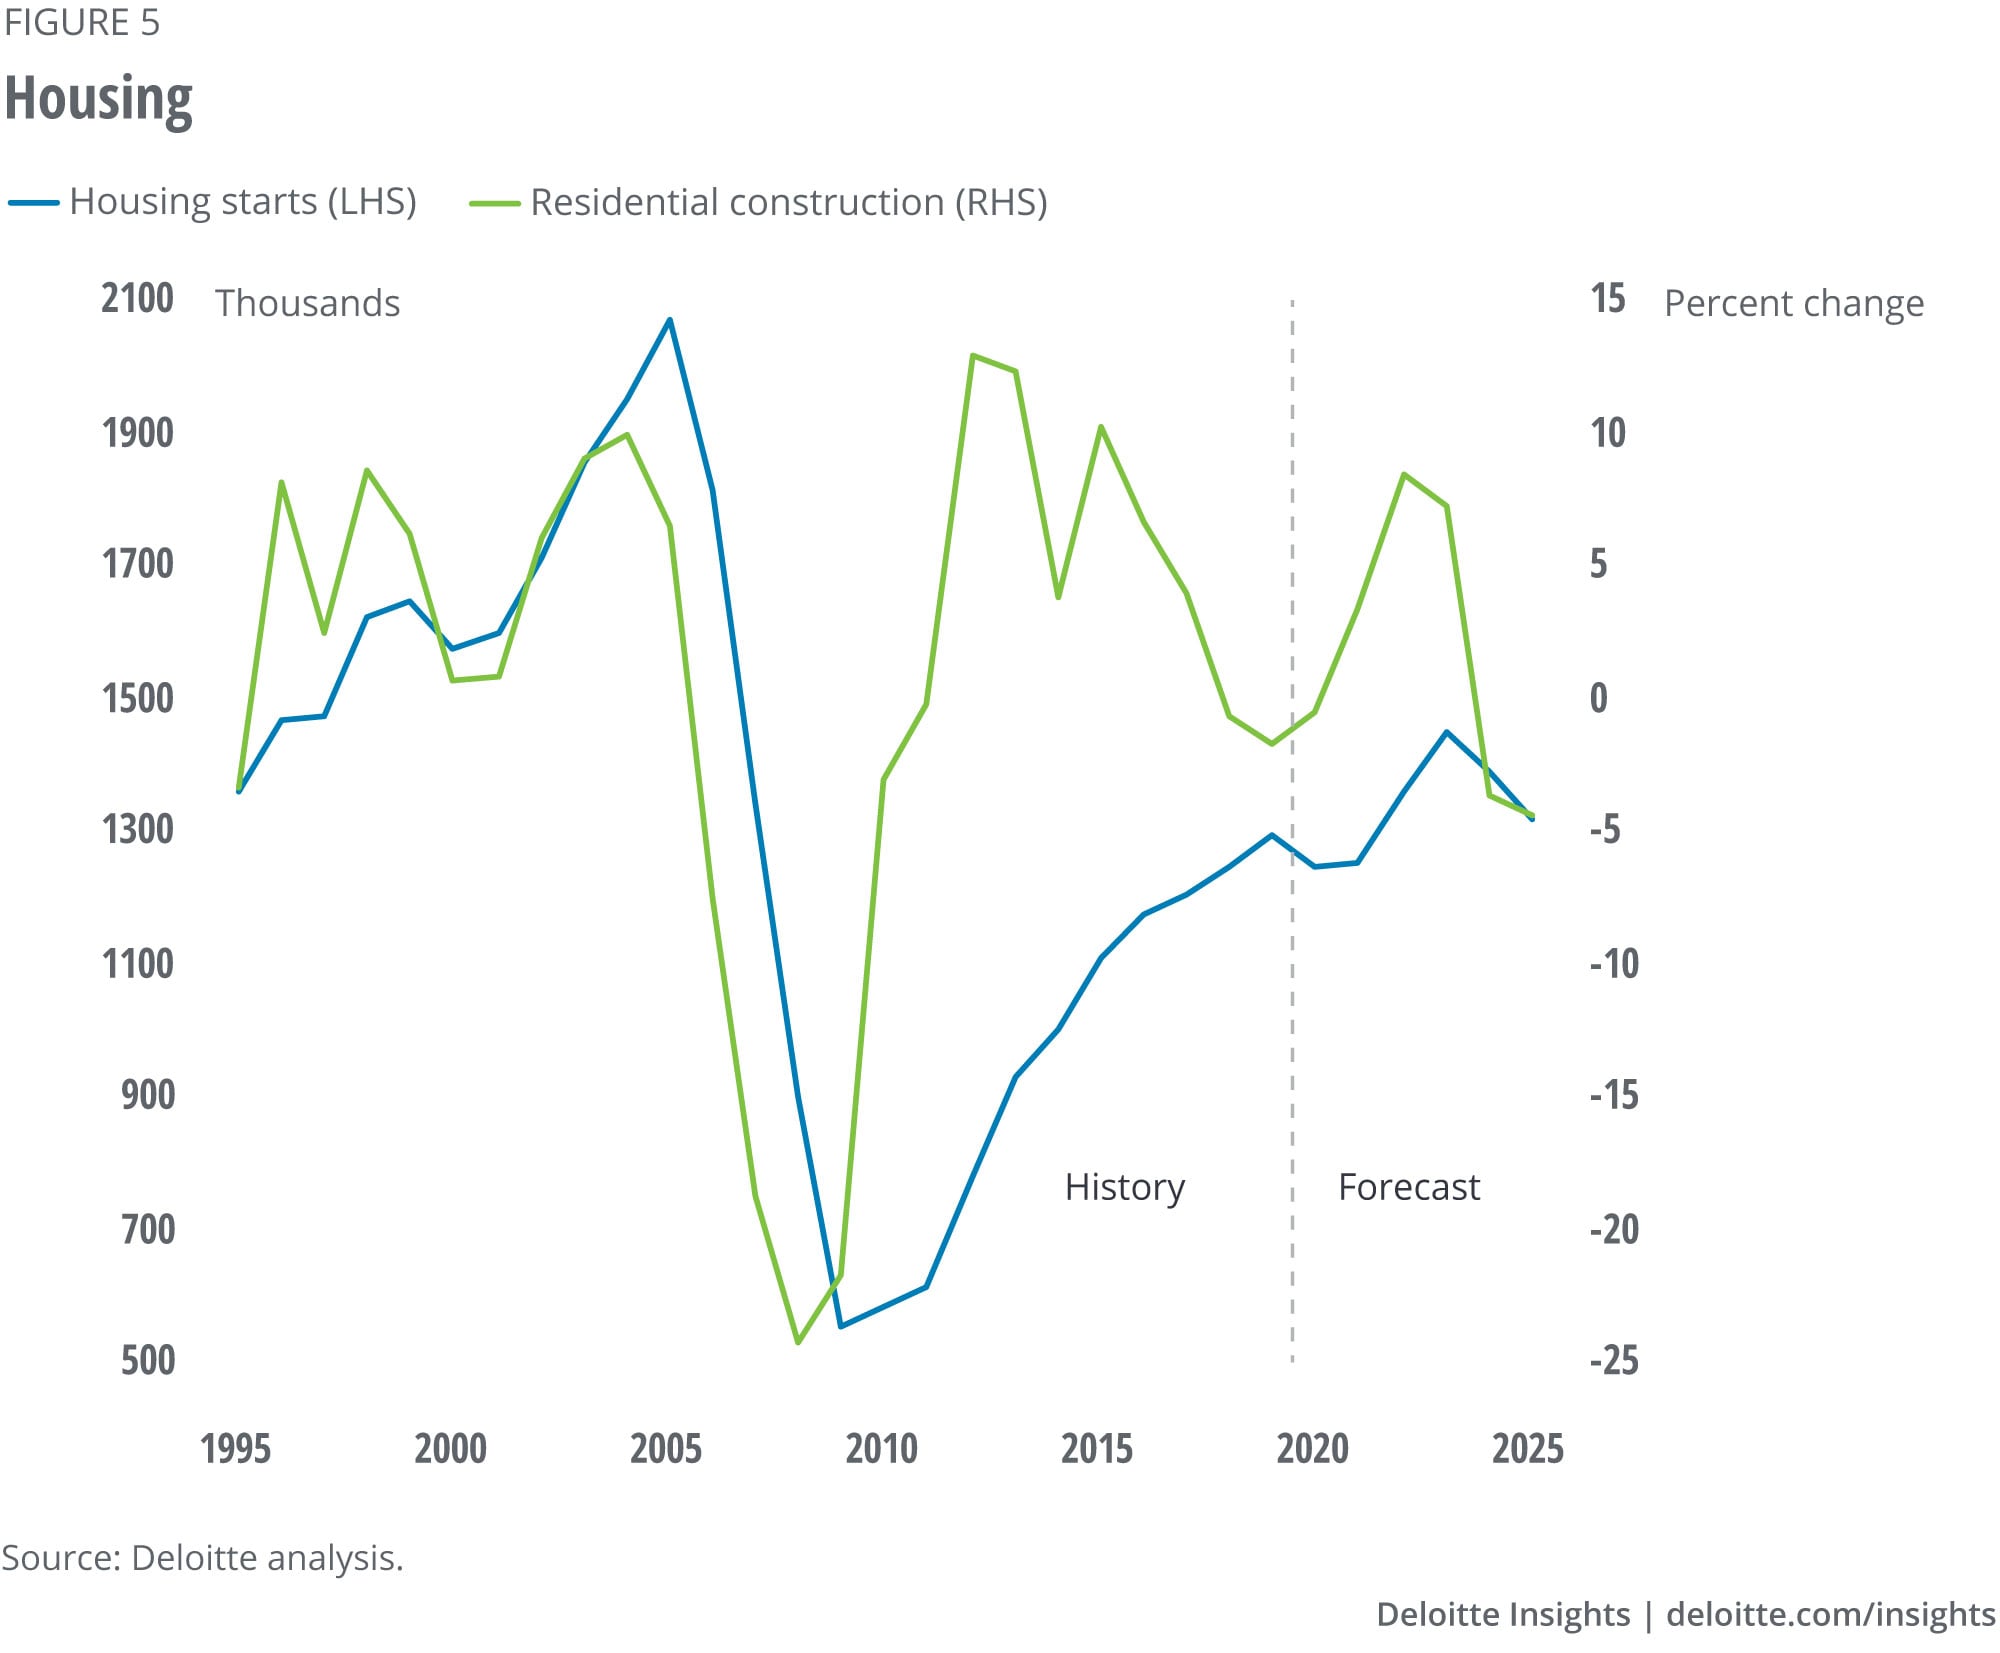
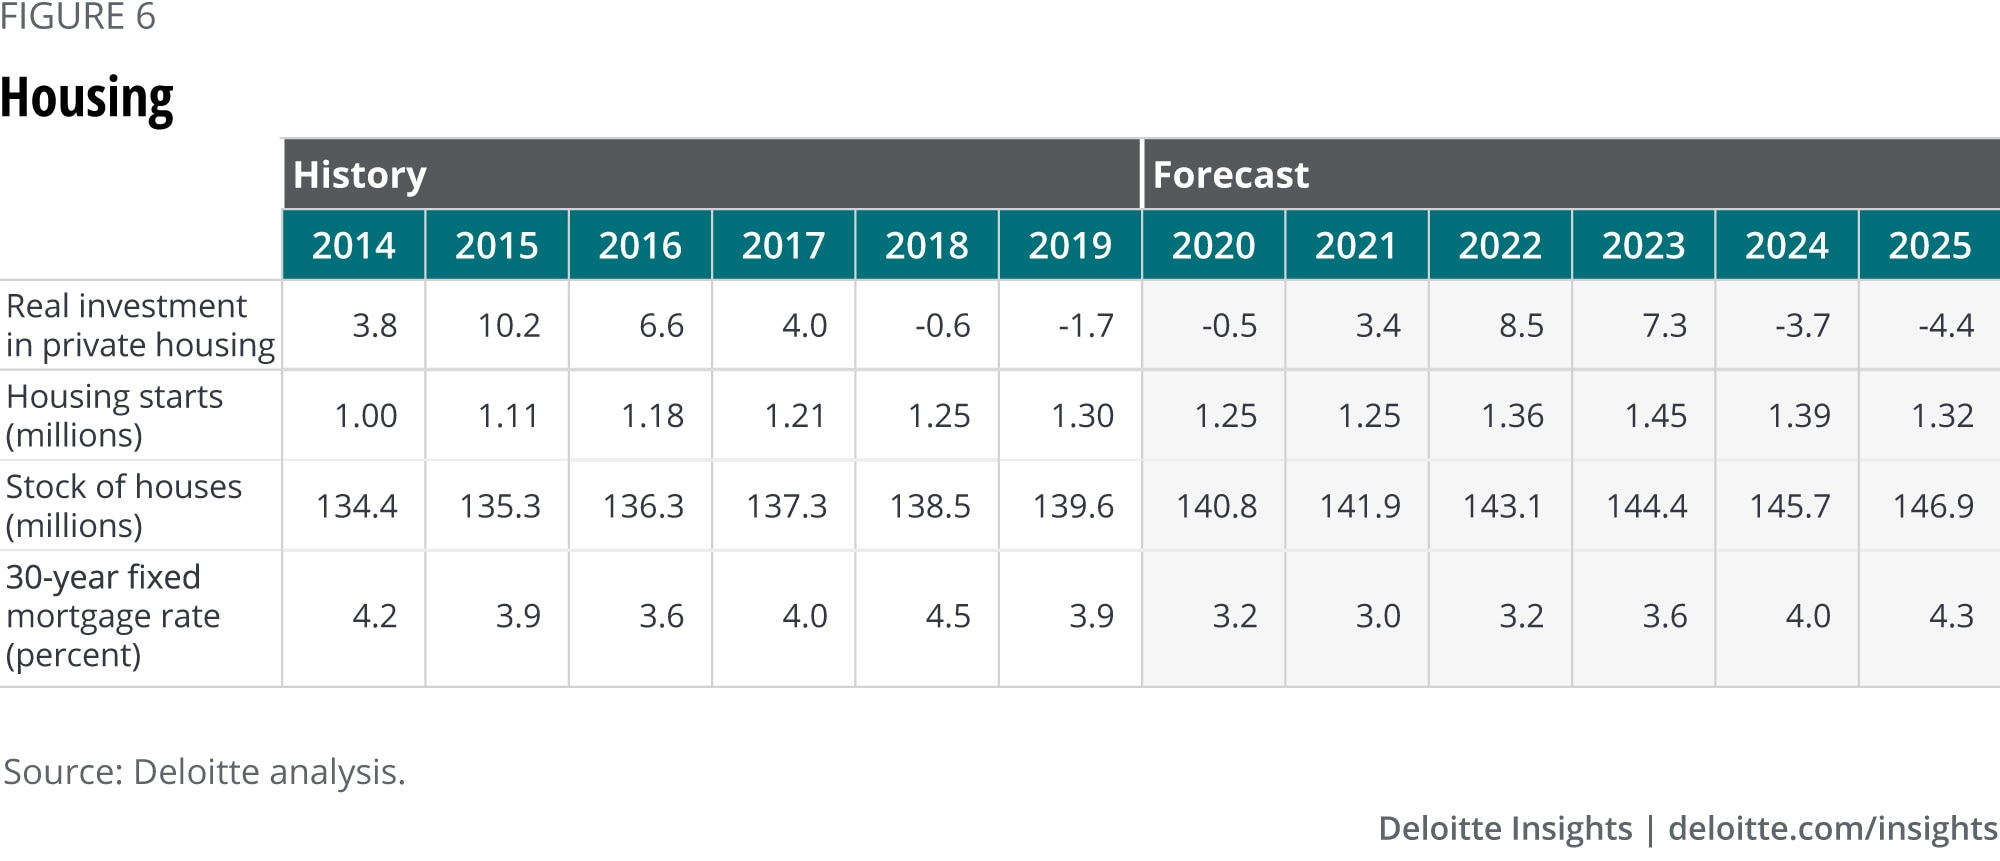
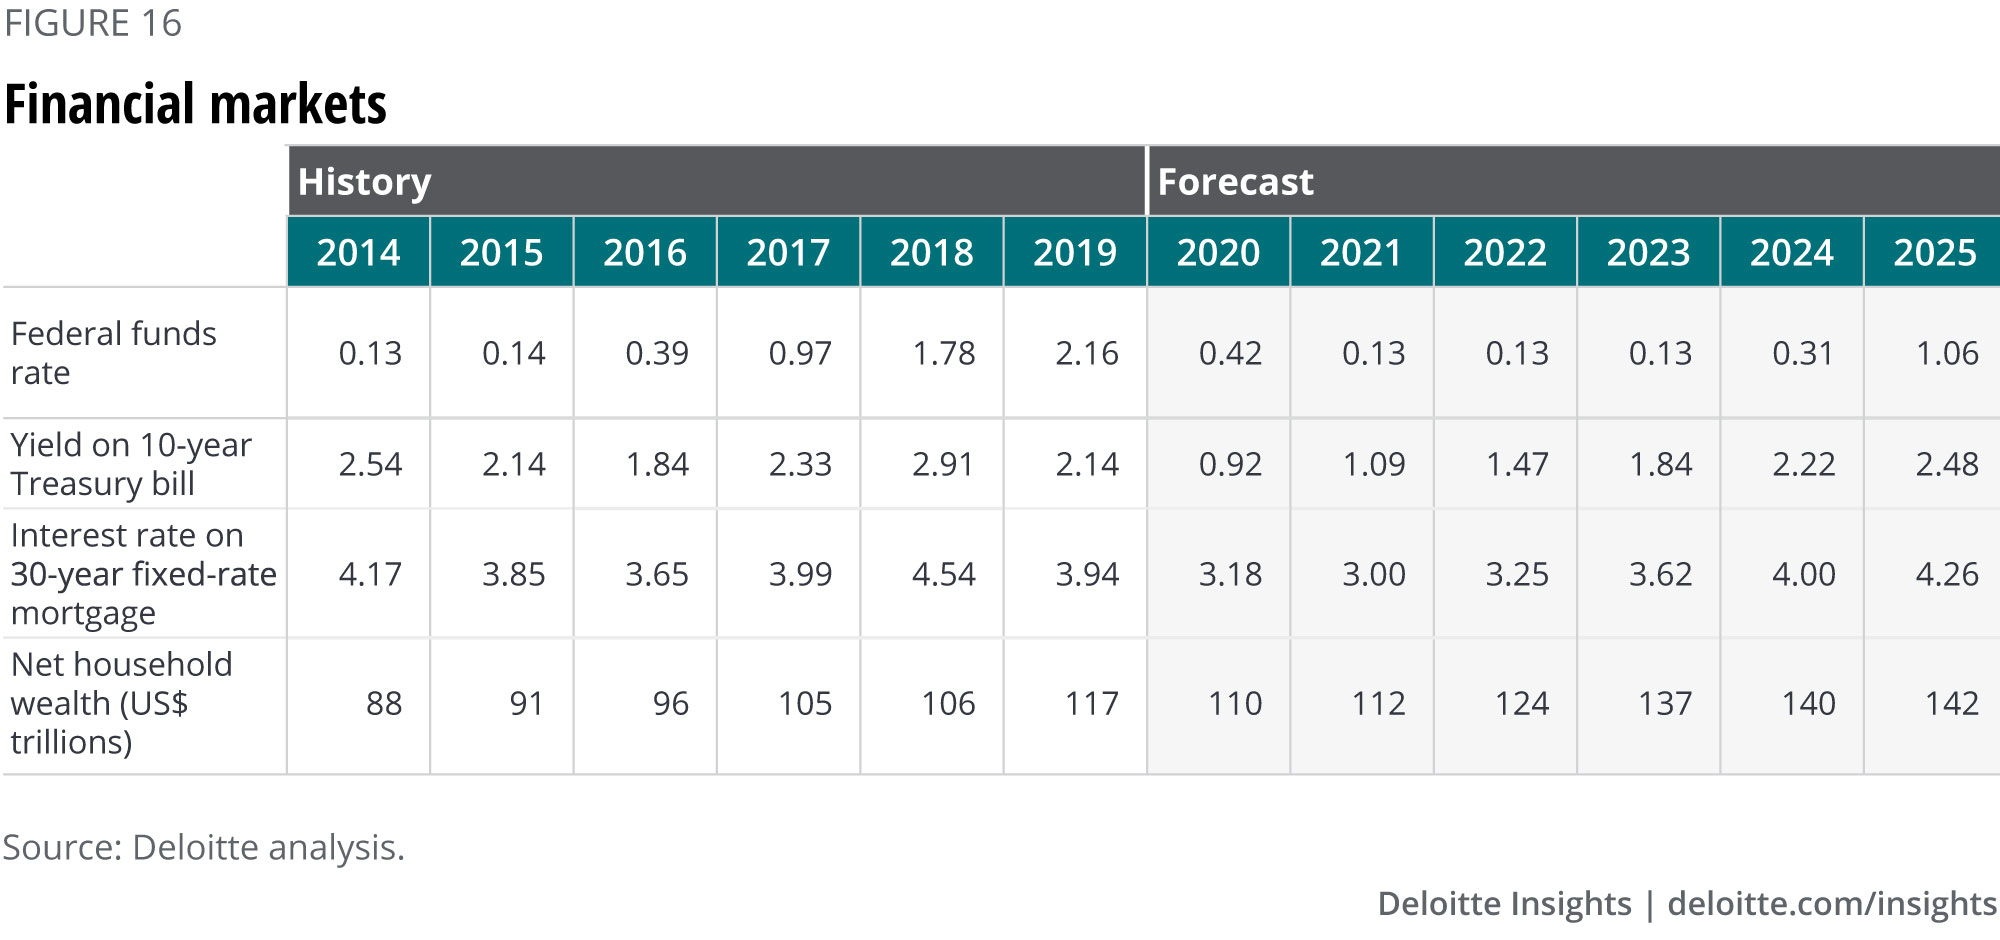
The housing sector has outperformed the broader economy in the wake of the pandemic. Real estate agents, buyers, and sellers have found ways to keep activity going even if they can’t meet easily or casually. This has lifted homebuilder confidence above pre-COVID levels,10 and by July, housing starts had already made up 90% of the ground lost between February and April. Historically, low interest rates and strong demand have driven this V-shaped recovery: The 30-year fixed-rate mortgage has continued a broad downward trend, dipping below 3% since the end of July. This has been a major attraction for buyers despite the weak labor market—mortgage purchase applications are up more than 20% from a year ago.11 Housing permits, an indicator of future starts, have also bounced back.
Low interest rates and strong demand coupled with suppressed housing supply are likely to boost house prices in 2020 and 2021. The outlook for homebuilders is more positive in the short to medium term relative to our previous forecast. Once the labor market recovery is clearly underway, we might see a further spurt in housing activity. A resurgence of the virus could pour cold water on this outlook.
Long-run fundamentals ensure that housing does not become a key driver of economic growth in our forecast. Slowing population growth means that the demand for housing will grow slowly. Moreover, an aging demographic means that more than a quarter of the nation’s existing owner-occupied homes are likely to become available over the next 20 years as the current owners either pass away or vacate their homes.12
Business investment
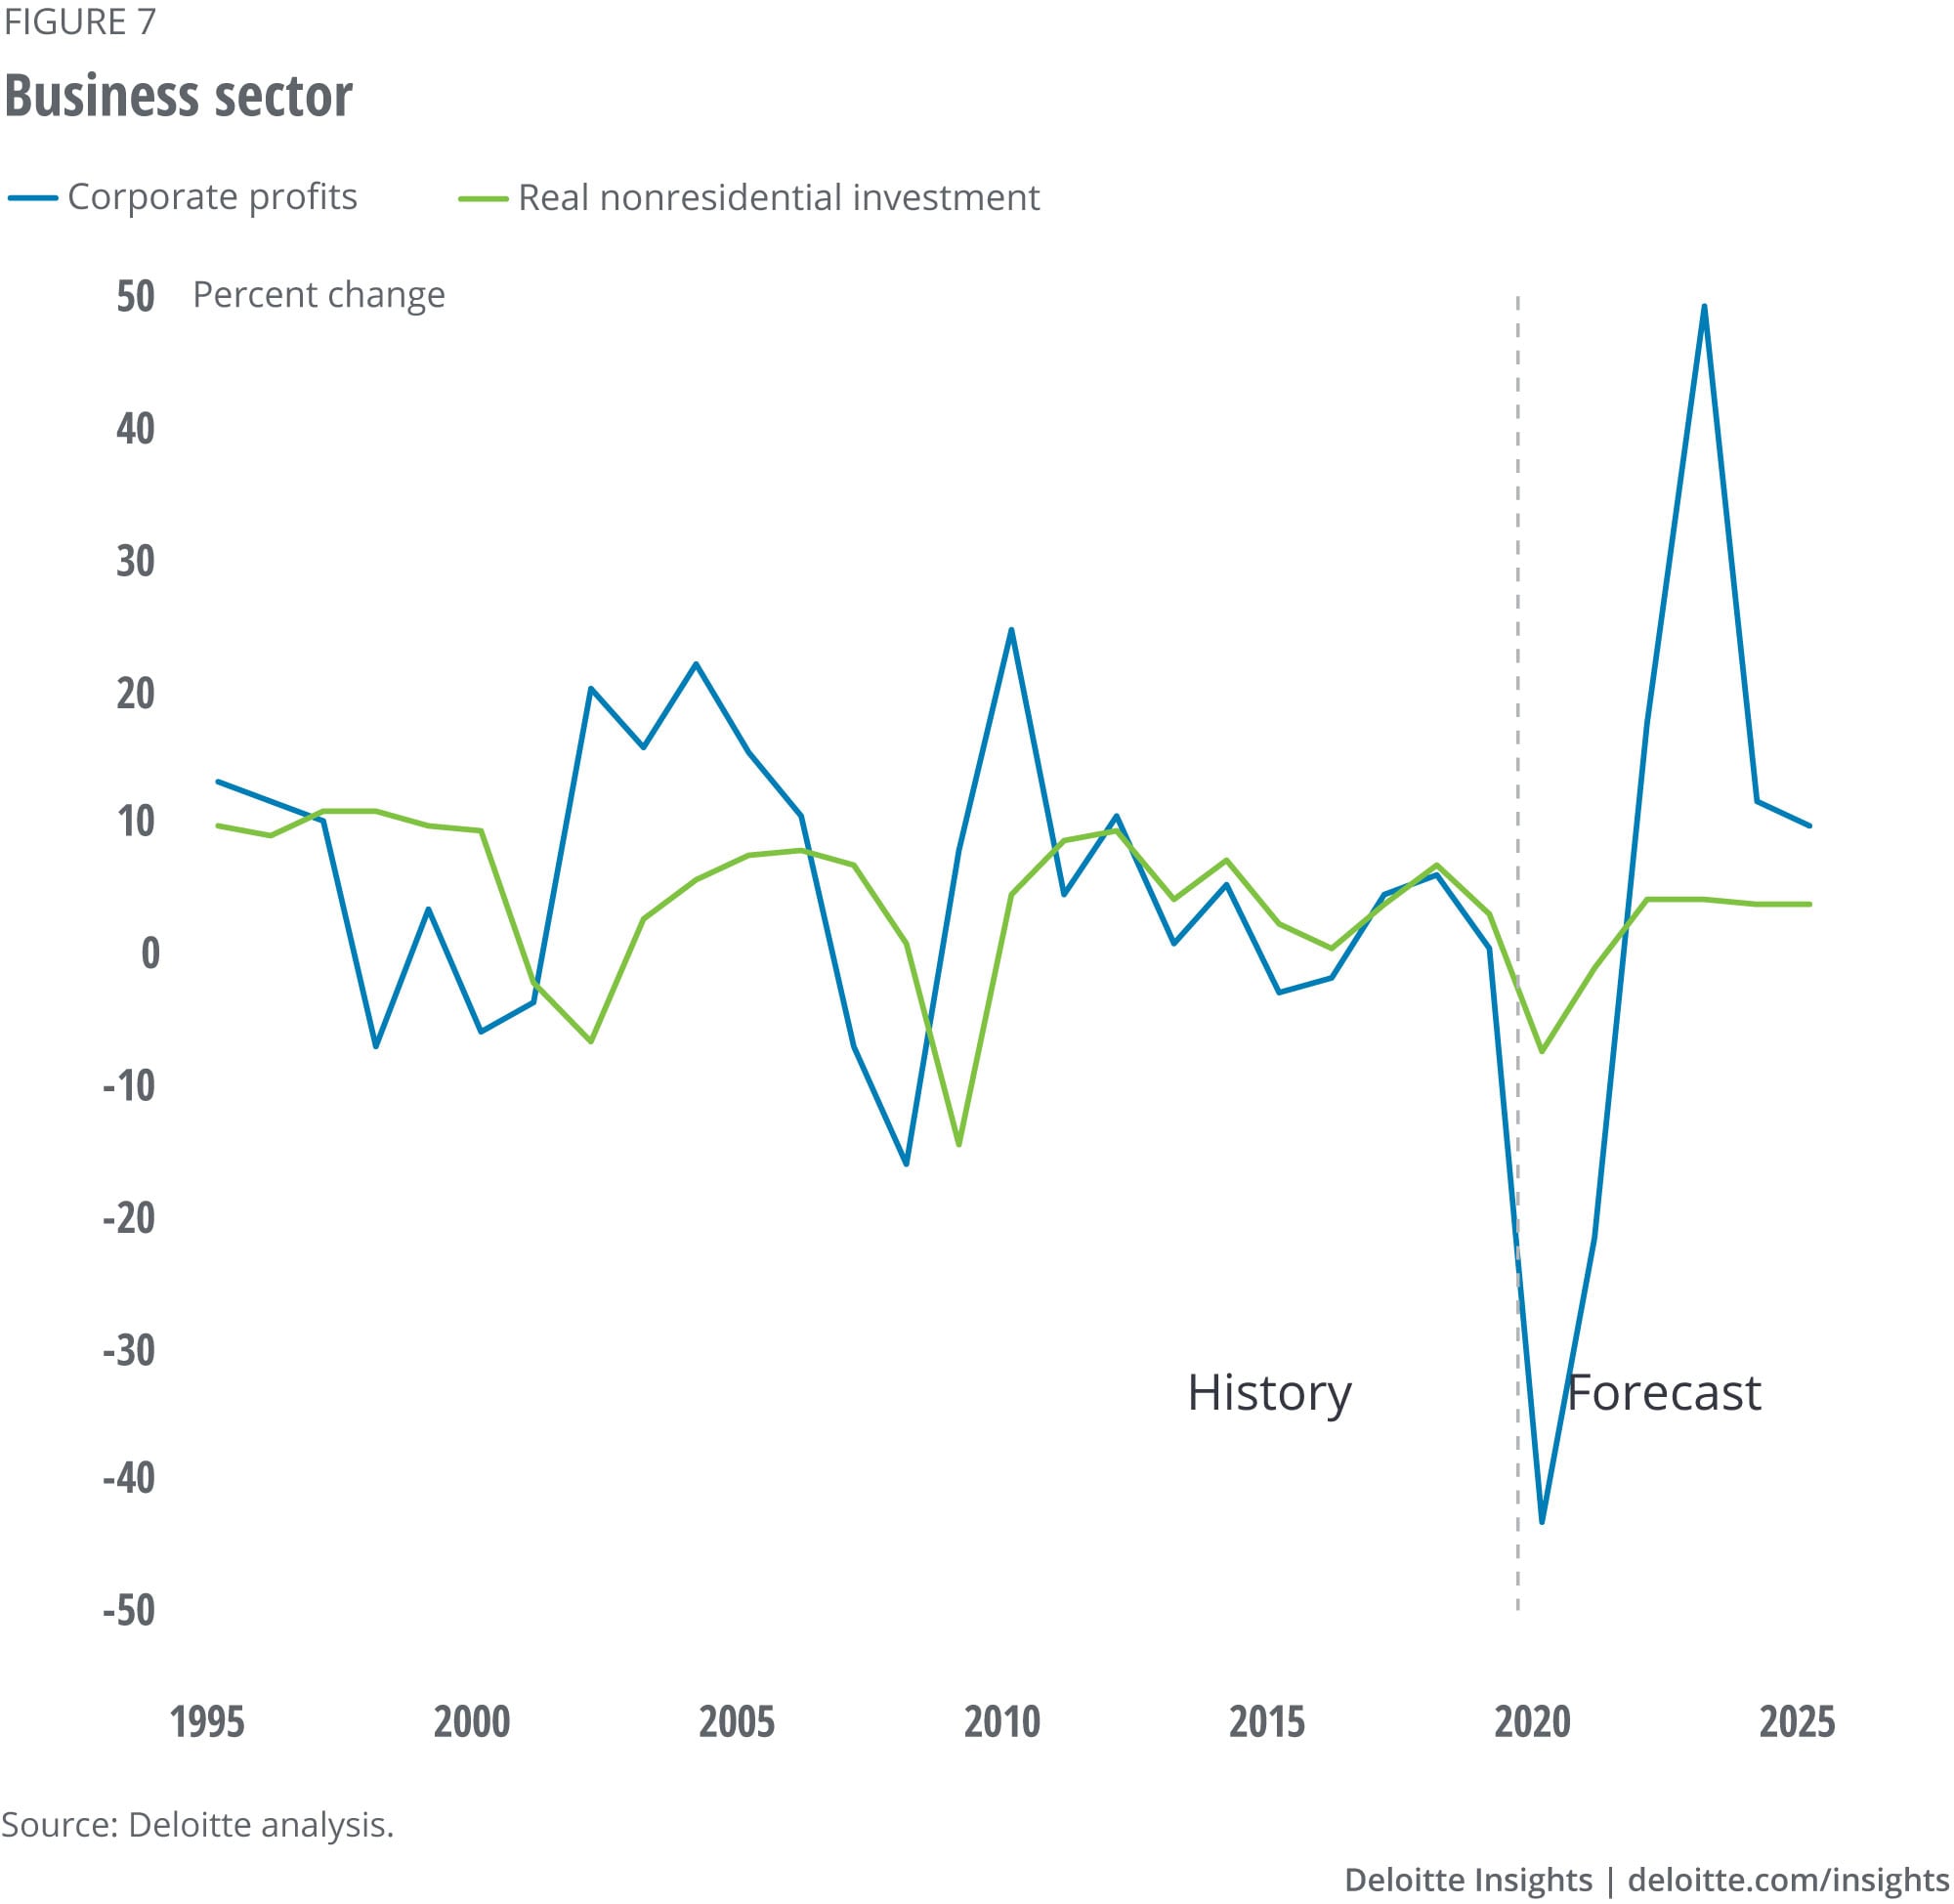
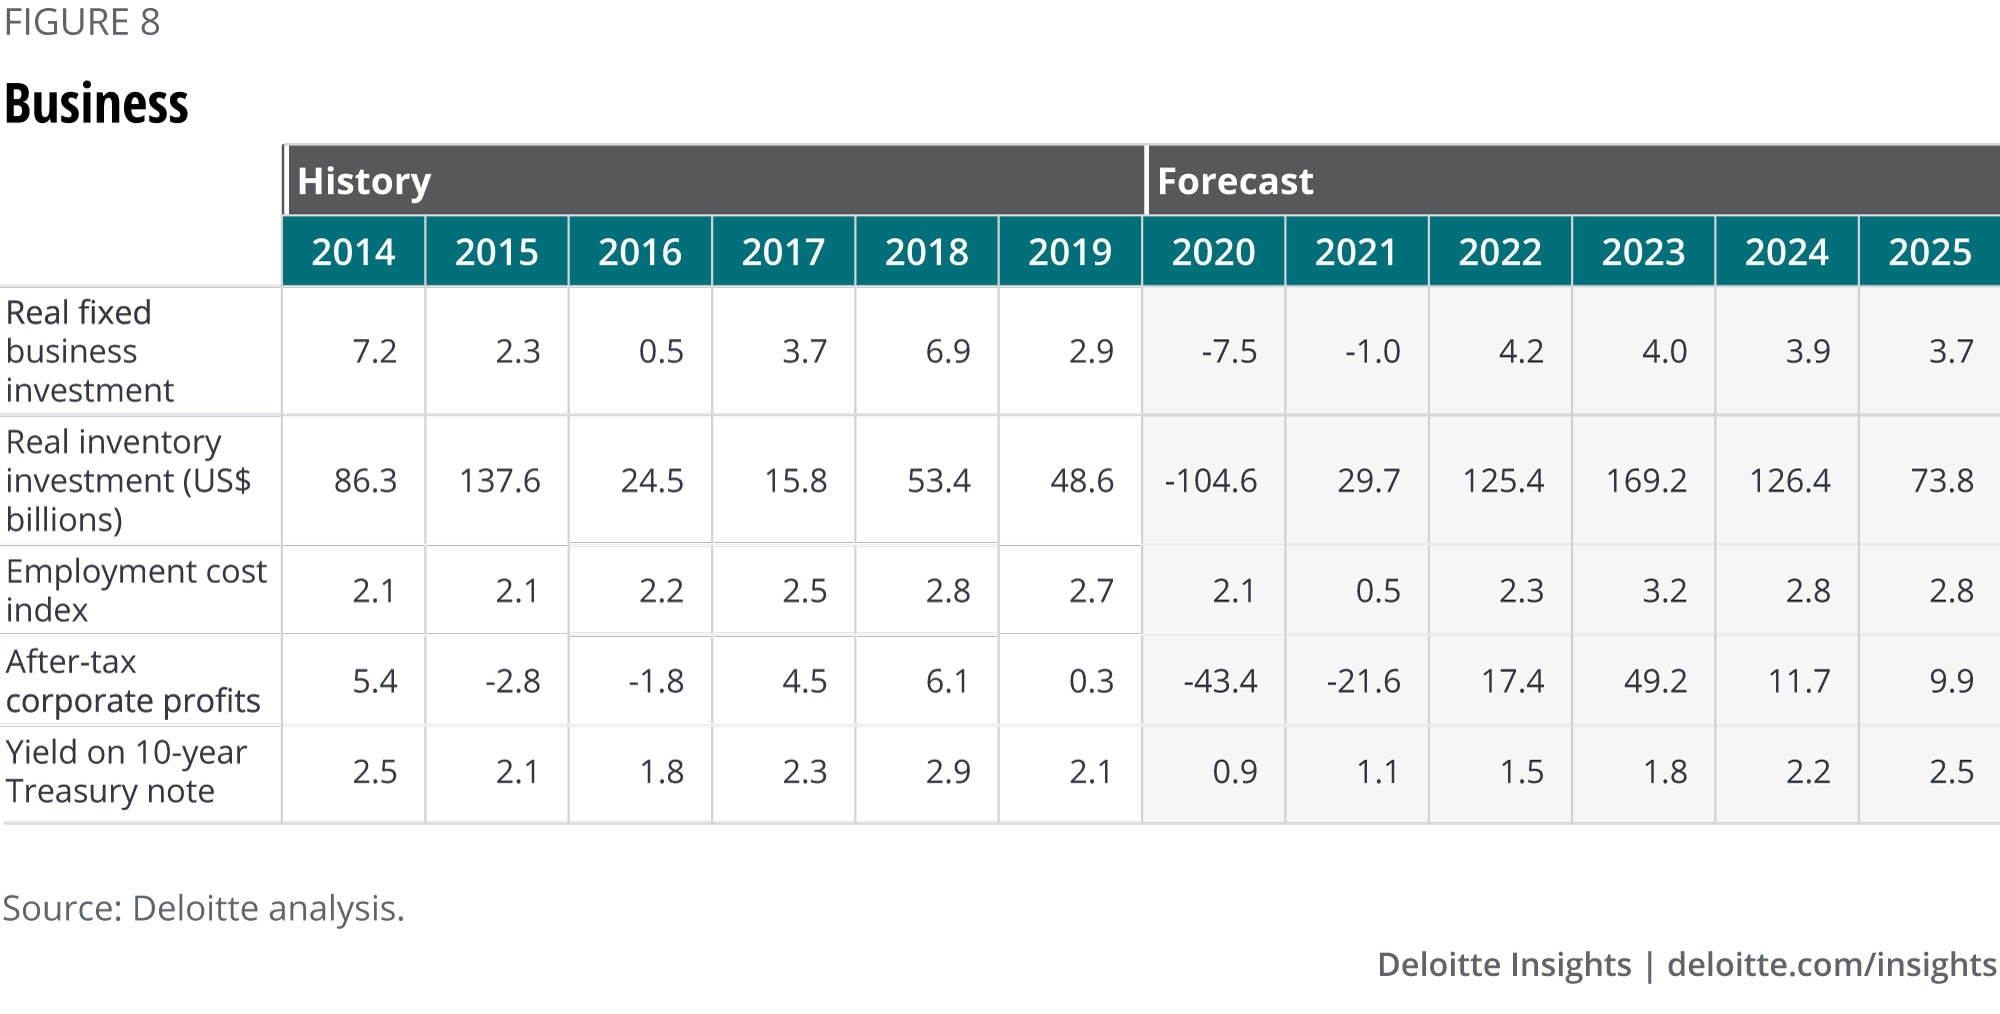
Most business investment was interrupted, like everything else, by the closing of the economy to slow the pandemic’s spread. Investing in certain specific areas that support virtual operations may be up—business purchases of information processing equipment rose 5% while GDP was falling in the second quarter—but not by enough to keep overall investment from dropping. As many states lifted stay-at-home orders, spending for equipment and structures began to grow again. However, the short-term recovery may not continue.
Expanding capacity may become a hard sell in a world of high unemployment and limited demand. And businesses face more than the usual amount of uncertainty—and uncertainty plays an important role in business investment.13
Businesses face uncertainty in several dimensions. There is uncertainty about the disease itself, raising difficult-to-answer questions for any business—questions about operations, customers, and costs. There are questions about the financial system, and the ability to fund new investments. And there are questions about the recovery—how quickly the unemployed will be able to find new jobs once the crisis is passed, and whether the government response will help the recovery.
Under these circumstances, business investment is likely to remain muted for some time. The forecast assumes that business spending will remain relatively soft until the overall economy begins to steadily recover in mid-2021.
At that point, there may be reasons for businesses to begin increasing investment. Some of those reasons, unfortunately, may actually reduce productivity. First, many businesses will need to spend on safety equipment that will neither improve productivity nor add to profits. Second, government policy may encourage reshoring in “strategic” industries, especially medically related industries such as instruments and pharmaceuticals, arguing that it’s worth some inefficiency to obtain better national control over these areas in a future crisis. Third, businesses are likely to consider investing in ways to make their supply chains more robust, including reshoring, diversifying suppliers, and/or increasing inventories of critical products. All of these will likely help prevent extreme events from shutting down production but reduce efficiency and add to costs in normal operation.
The United States may, therefore, see relatively high levels of investment in this recovery. But it may not achieve the higher productivity we would normally expect that investment to generate.
Foreign trade
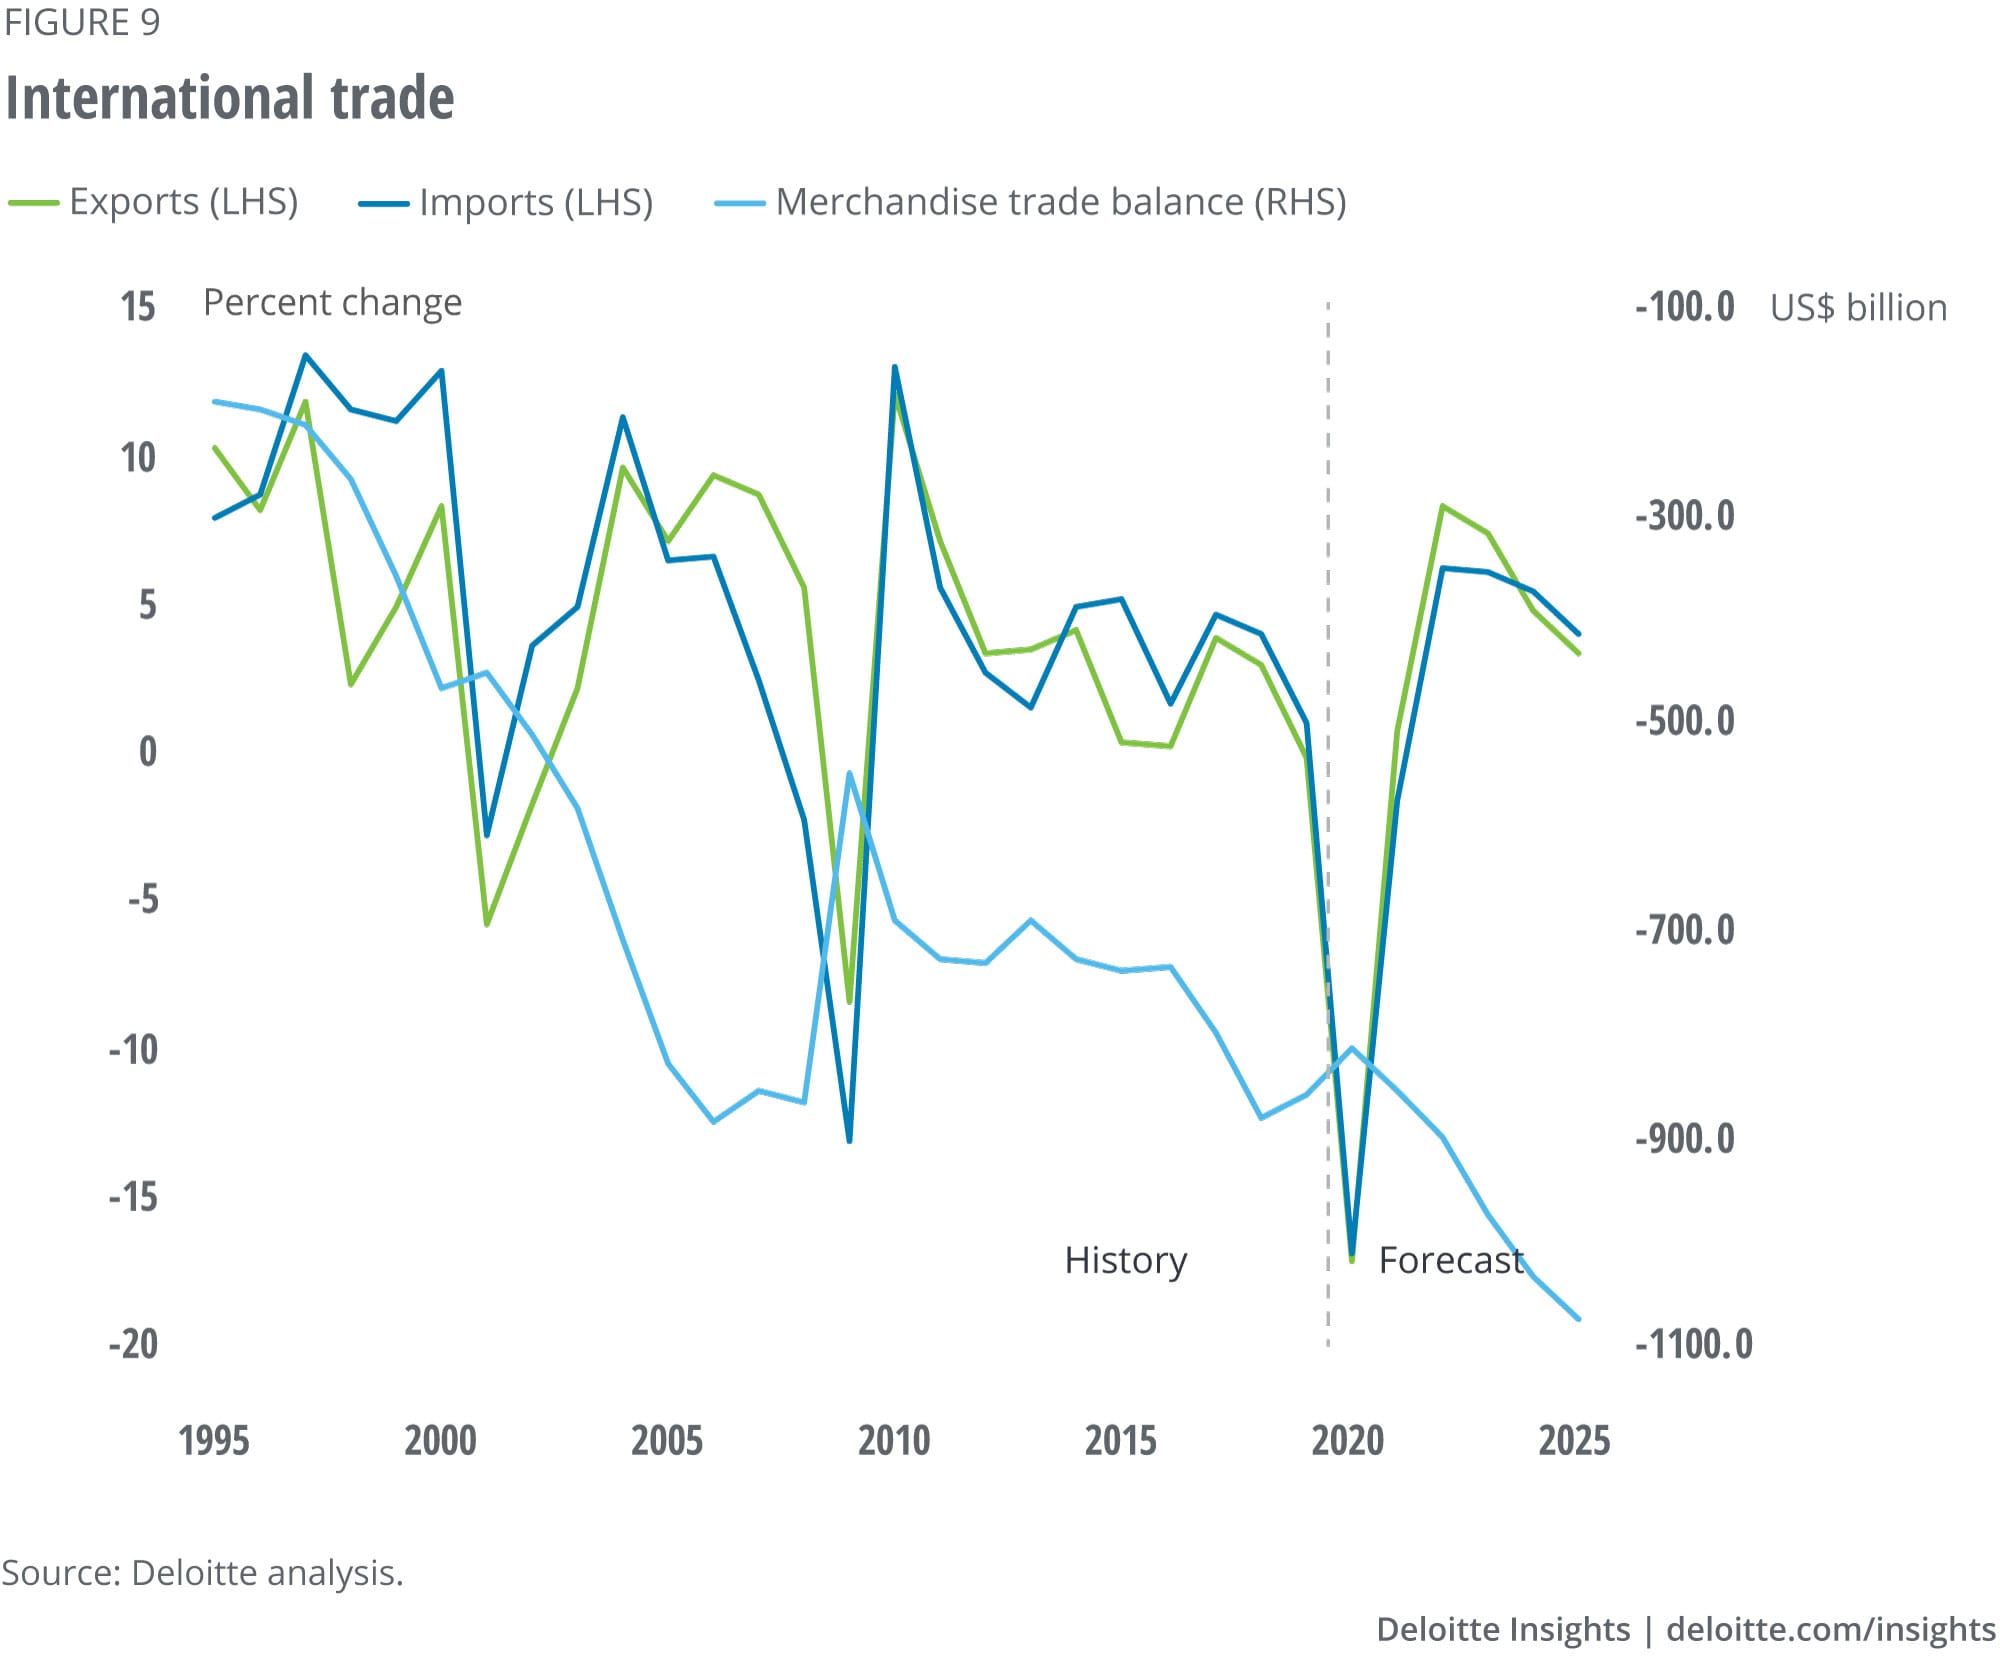
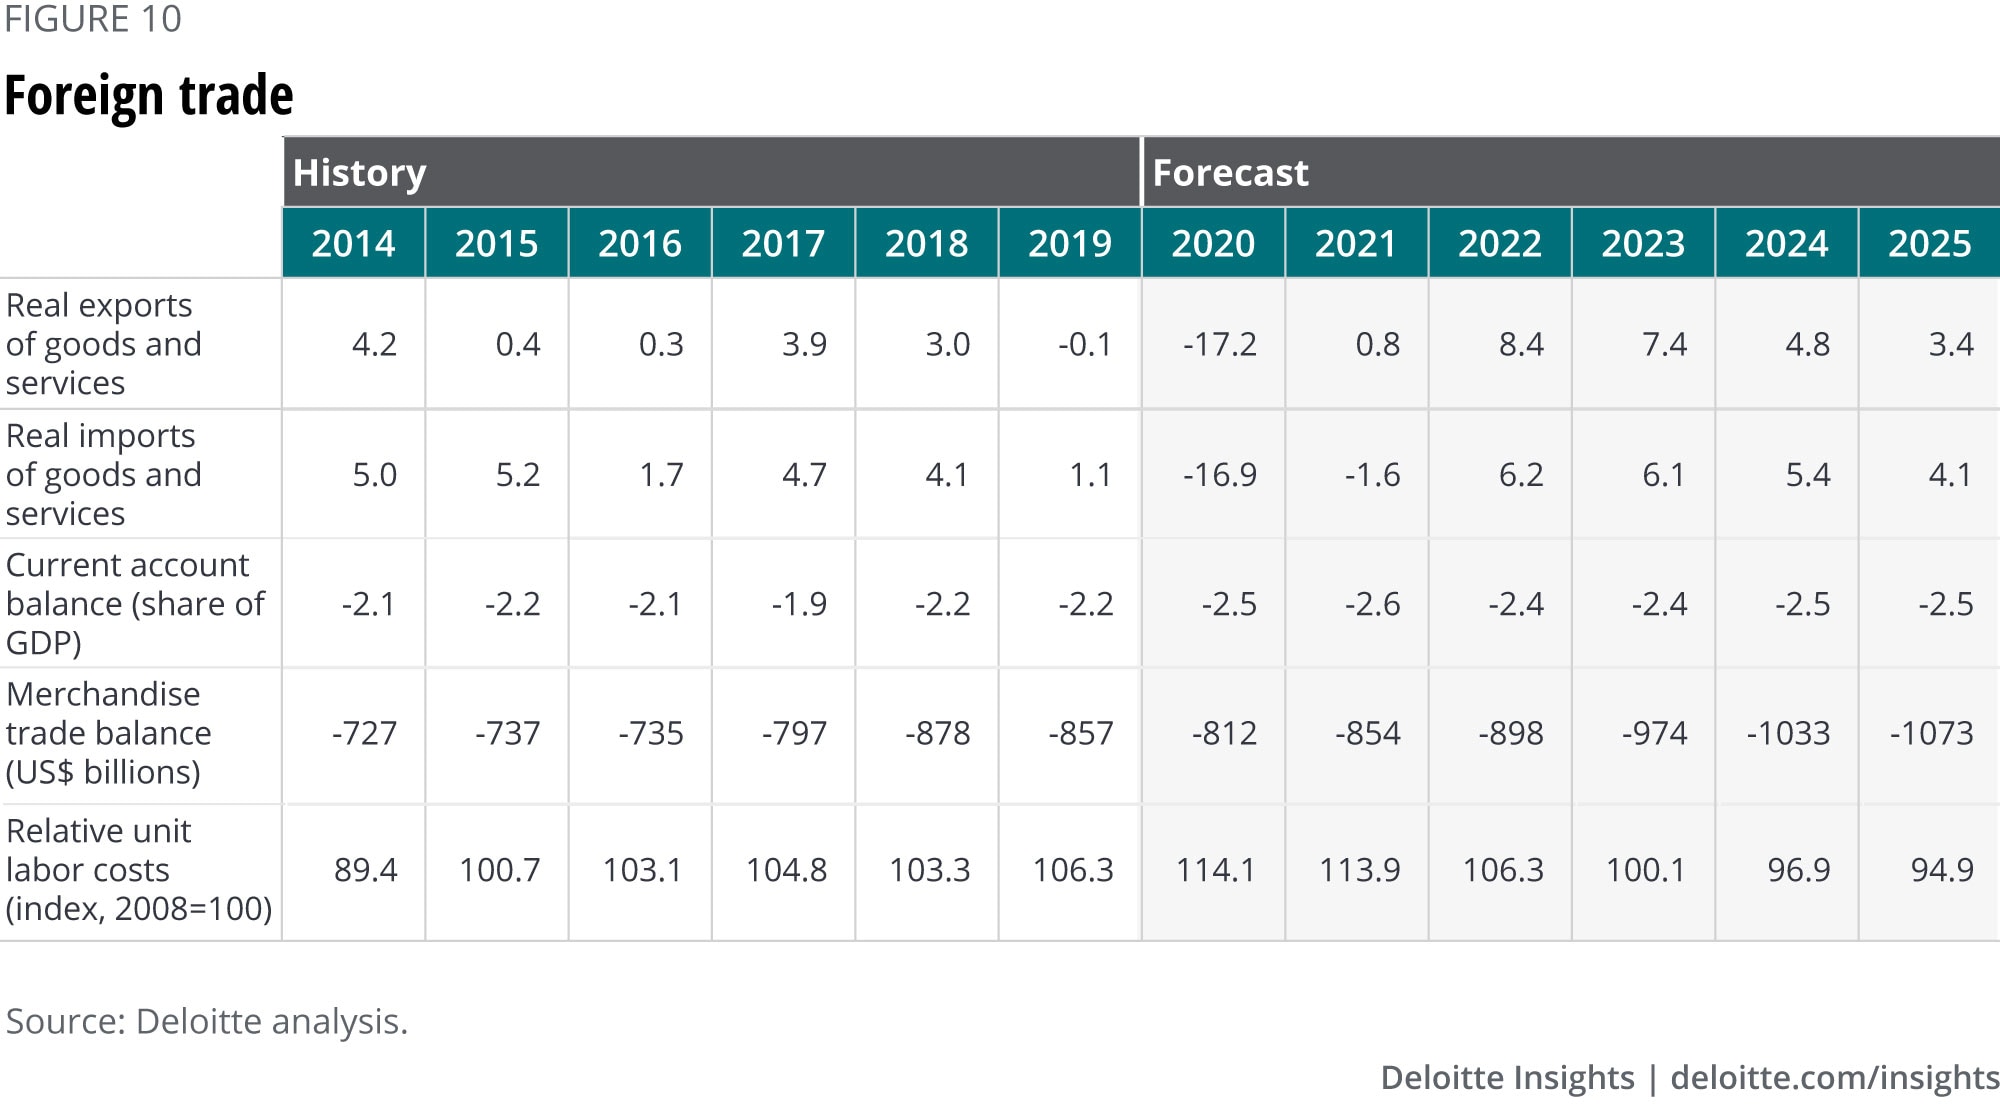
Over the past few years, analysts have begun to face the possibility of deglobalization. Global exports grew from 13% of global GDP in 1970 to 34% in 2012, but globalization then began to stall, the share of exports in global GDP started to fall, and opponents of freer trade have taken power in key countries (most notably the United States and the United Kingdom), suggesting that the policies that fostered globalization may change in the future.
COVID-19 may have accelerated this trend. Although the pandemic is a global phenomenon, leaders have made major decisions about how to fight it—in both health and economic policy—on a country-by-country basis. Some analysts foresee the pandemic accelerating deglobalization as national governments begin to compete for scarce medical supplies and even knowledge.14 In the midst of the pandemic, the US-China trade war shows no sign of abating. And almost immediately after the adoption of the USMCA trade treaty for North America, the United States imposed tariffs on Canadian aluminum. That’s not a good sign for the future of international cooperation and continued open borders.
It’s impossible, of course, to simply and quickly refashion supply chains to reduce foreign dependence. American companies will continue to source from China in the coming years. But companies will likely begin to reduce their dependence on foreign suppliers, or attempt to have a portfolio of suppliers rather than a single source, even if the single source is the cheapest. Reengineering supply chains will inevitably mean a rise in overall costs. Just as the “China price” held inflation in check for years, an attempt to avoid being dependent on China might just create inflation pressures in the later years of our forecast horizon. And if markets won’t accept inflation, companies will have to accept lower profits in order to diversify supply chains. Globalization has offered a comparatively painless way to improve most people’s standard of living; deglobalization will involve painful costs and limit real income growth during the recovery.
Government
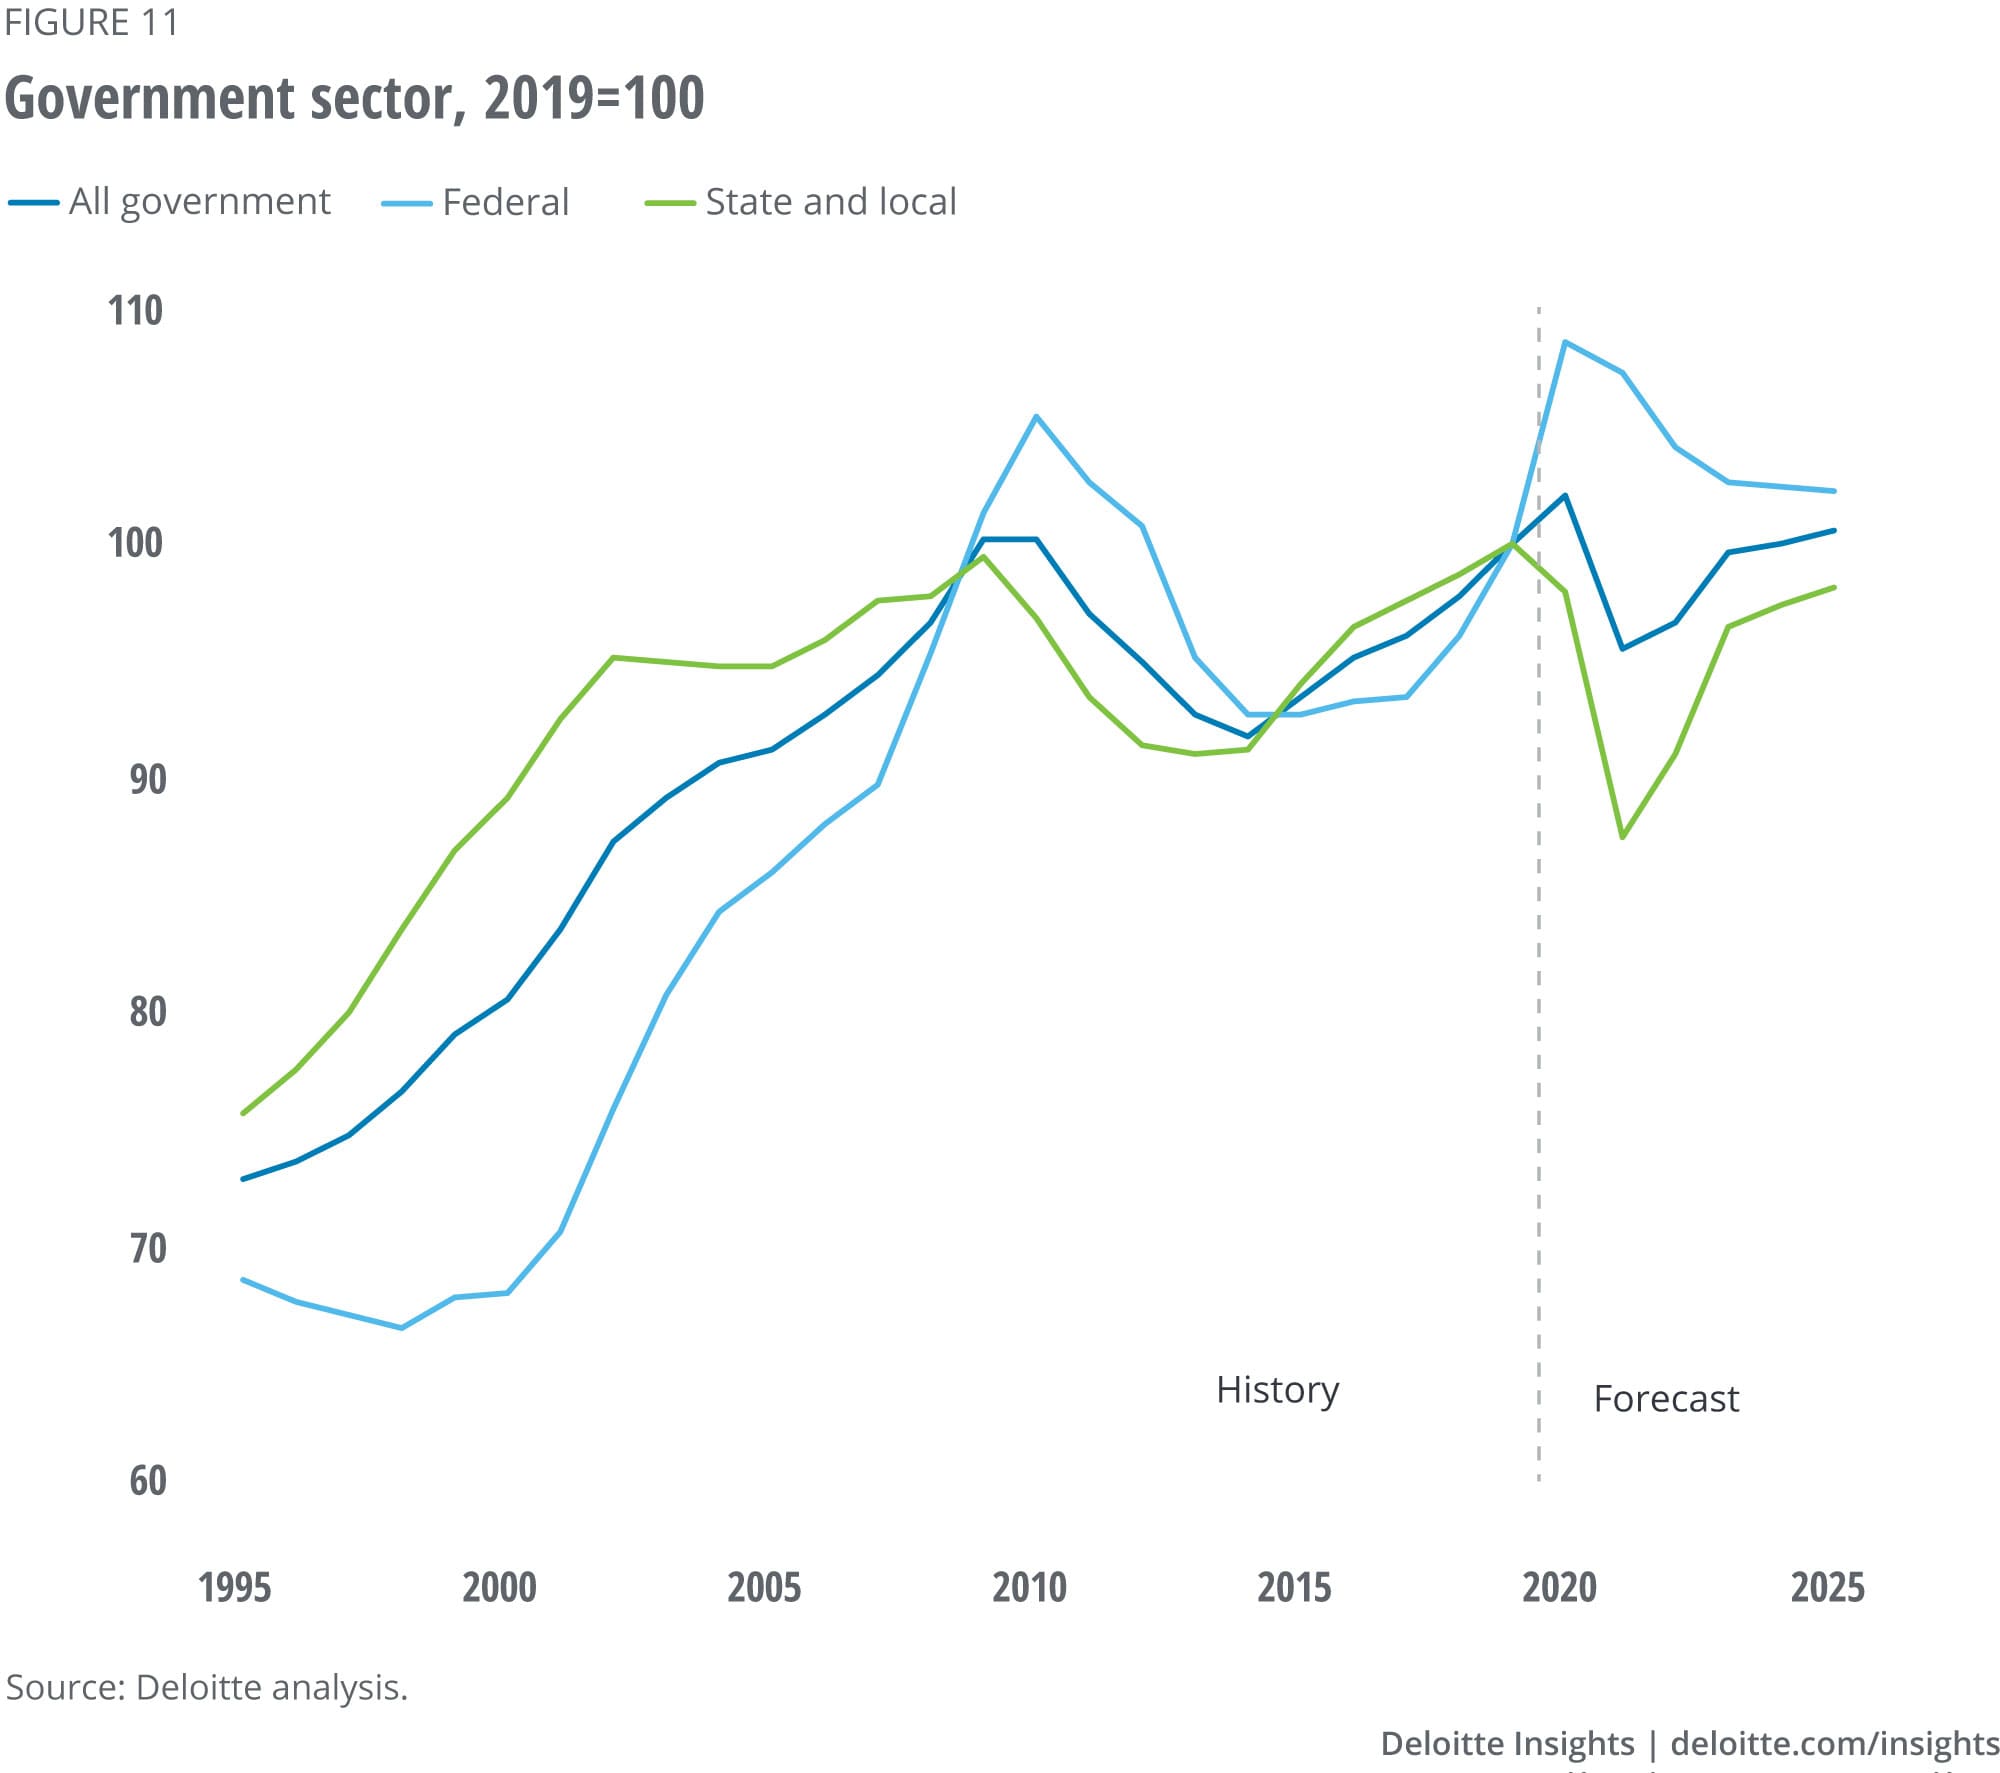
This summer saw the US government fail to rise to the challenge of managing the economic hit from the pandemic. Earlier, Congress and the president came to a swift agreement for a variety of programs to provide a financial bridge to workers and businesses. Unfortunately, the crisis has lasted longer than anticipated in that initial policy response. The Democratic-controlled House of Representatives passed the HEROES act in May to extend and broaden the policy response. The Republican-controlled Senate took longer, passing the much smaller HEALS act in July, leaving little time before the key deadline—the end of the US$600 supplement to unemployment insurance. Then the three-way negotiations between Senate, House, and the Trump administration fell apart, leaving the economy on shaky ground.
In addition to the end of the supplement reducing personal income by as much as 4.5% in August, and the budget shortfalls facing state and local governments, the partial eviction protection provided under the CARES act expired in August. All of these problems make it likely that the economic outlook will look increasingly bleak in the fall.
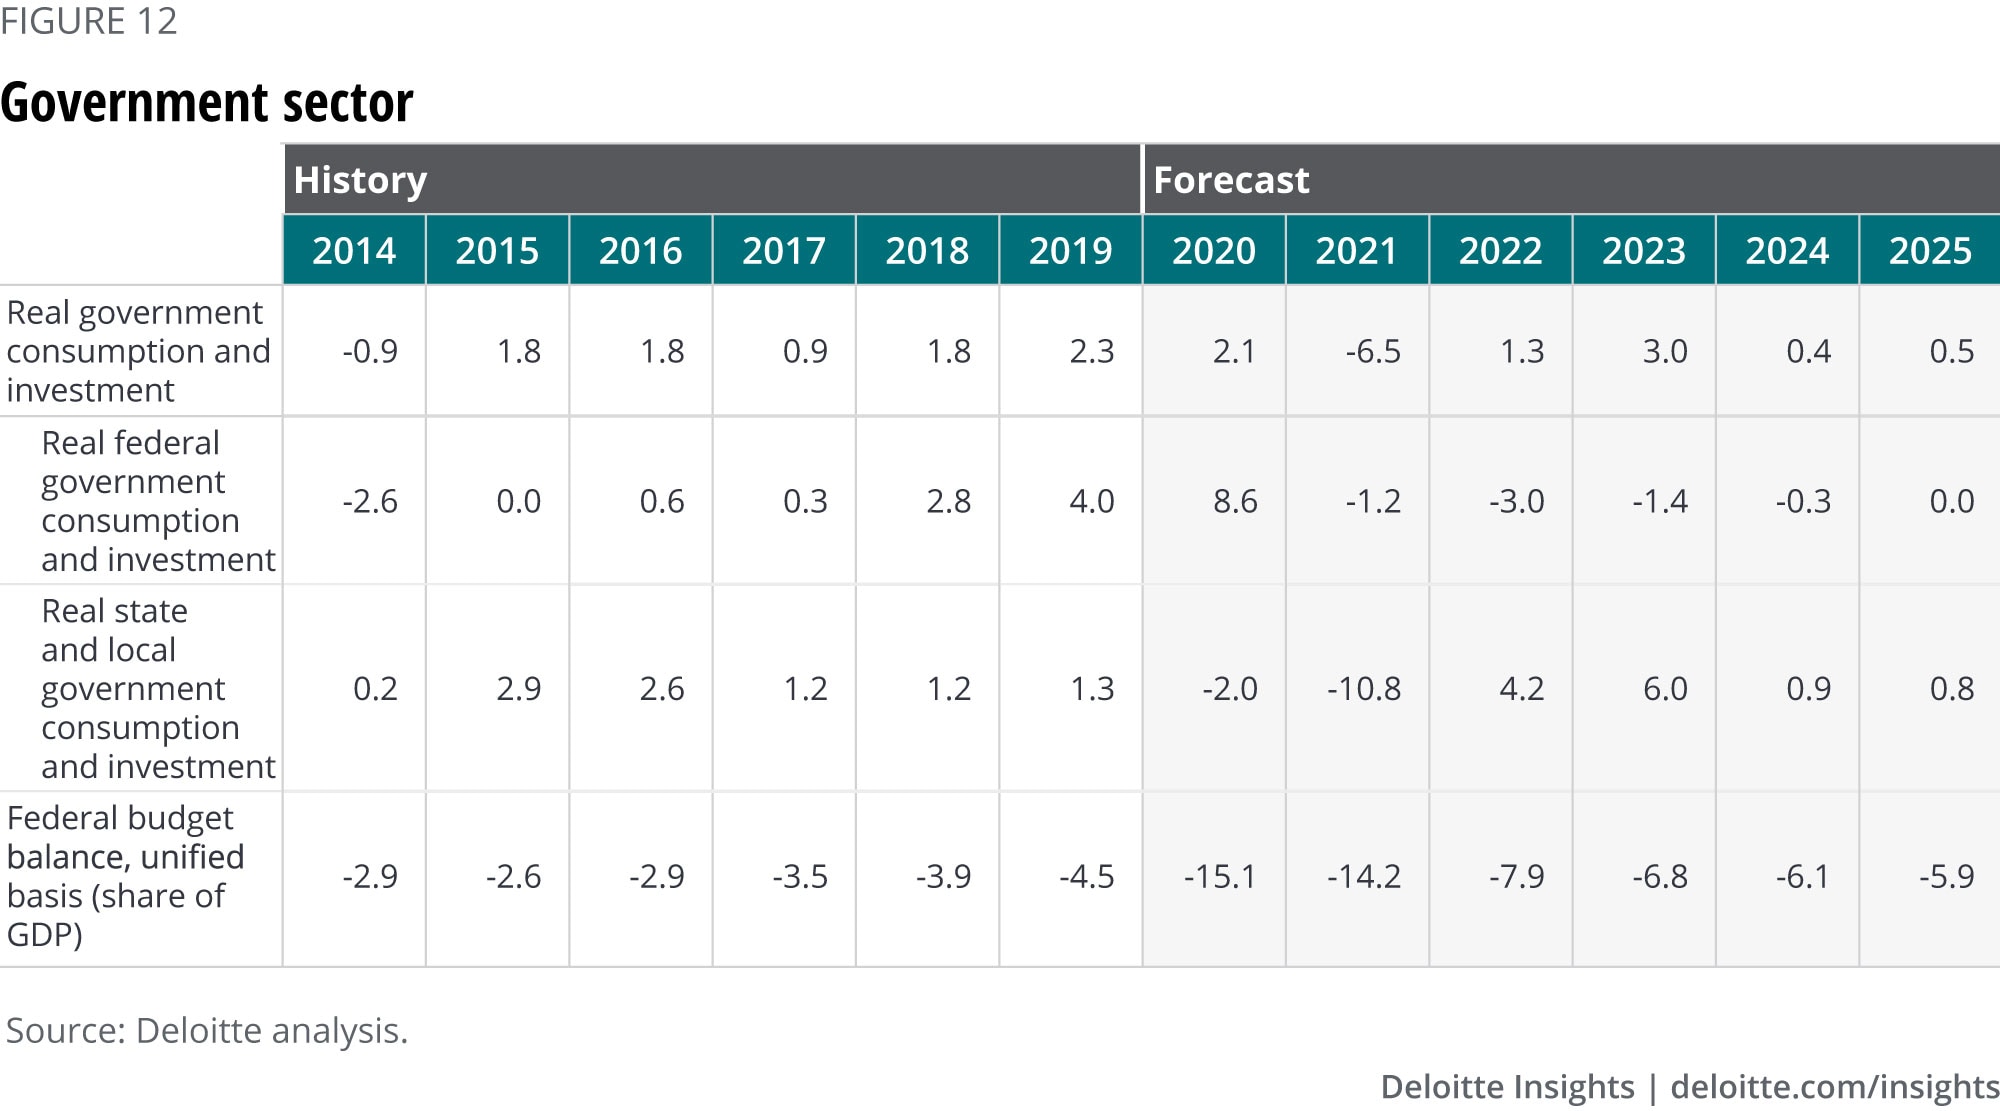
Unless Congress and the president come to an agreement in the early fall, the economy is likely to take a significant hit in the August–October time frame. Our baseline scenario assumes no new relief bill before the election, and that state and local employment and spending fall by about 10% over the next year or so, before rebounding (presumably with federal help) in 2022. Our optimistic scenario assumes an agreement in early September, perhaps as part of a budget deal. Whether such a deal can happen in this political climate remains an open question, and the possibility of a federal government shutdown in October is real, although we have not included it in either scenario. An October shutdown would push Q4 even further into negative territory.
Then there is the important question of what the federal government should do once the economy is able to reopen. There are two possibilities:
The economy may need no stimulus. This optimistic view assumes that reopening will allow businesses to quickly rehire workers and resume pre-pandemic operations, and that economic growth will be very strong.
The economy may remain stagnant even without the disease hanging over it. Despite the government’s efforts, some (many?) businesses may be unable to reopen. Shifting consumer demand and business operations might require a period of adjustment. In this case, traditional government stimulus may be necessary to avoid persistent high unemployment.
If a stimulus is required, the package’s composition will determine its effectiveness. The Congressional Budget Office suggests that the multiplier, or bang for the buck, of federal spending on GDP is higher from direct federal spending, or transfers to state and local governments, for infrastructure than for tax cuts.15 An effective stimulus will likely focus on those areas.
All of this spending has ballooned the budget deficit. The CBO expects federal debt held by the public to equal over 100% of GDP by the end of the current fiscal year. The Deloitte baseline shows the annual federal deficit remaining at over US$1.5 trillion through 2025, the end of our forecast horizon. This is larger than the largest deficit run during the global financial crisis.
This inevitably raises the question of whether the US government can continue to borrow at such a pace. The answer is that it can—until investors lose confidence. At this point, investors show no sign of concern about US debt. In fact, very low interest rates on US government debt indicate that the world wants more, not less, US debt. We anticipate no problem over the forecast horizon. But the government will eventually be faced with a crisis if it does not eventually find ways to reduce the deficit and consequent borrowing. That crisis may be many years away, and current conditions argue for waiting. It would be a bad idea to wait too long once those conditions lift.
Labor markets
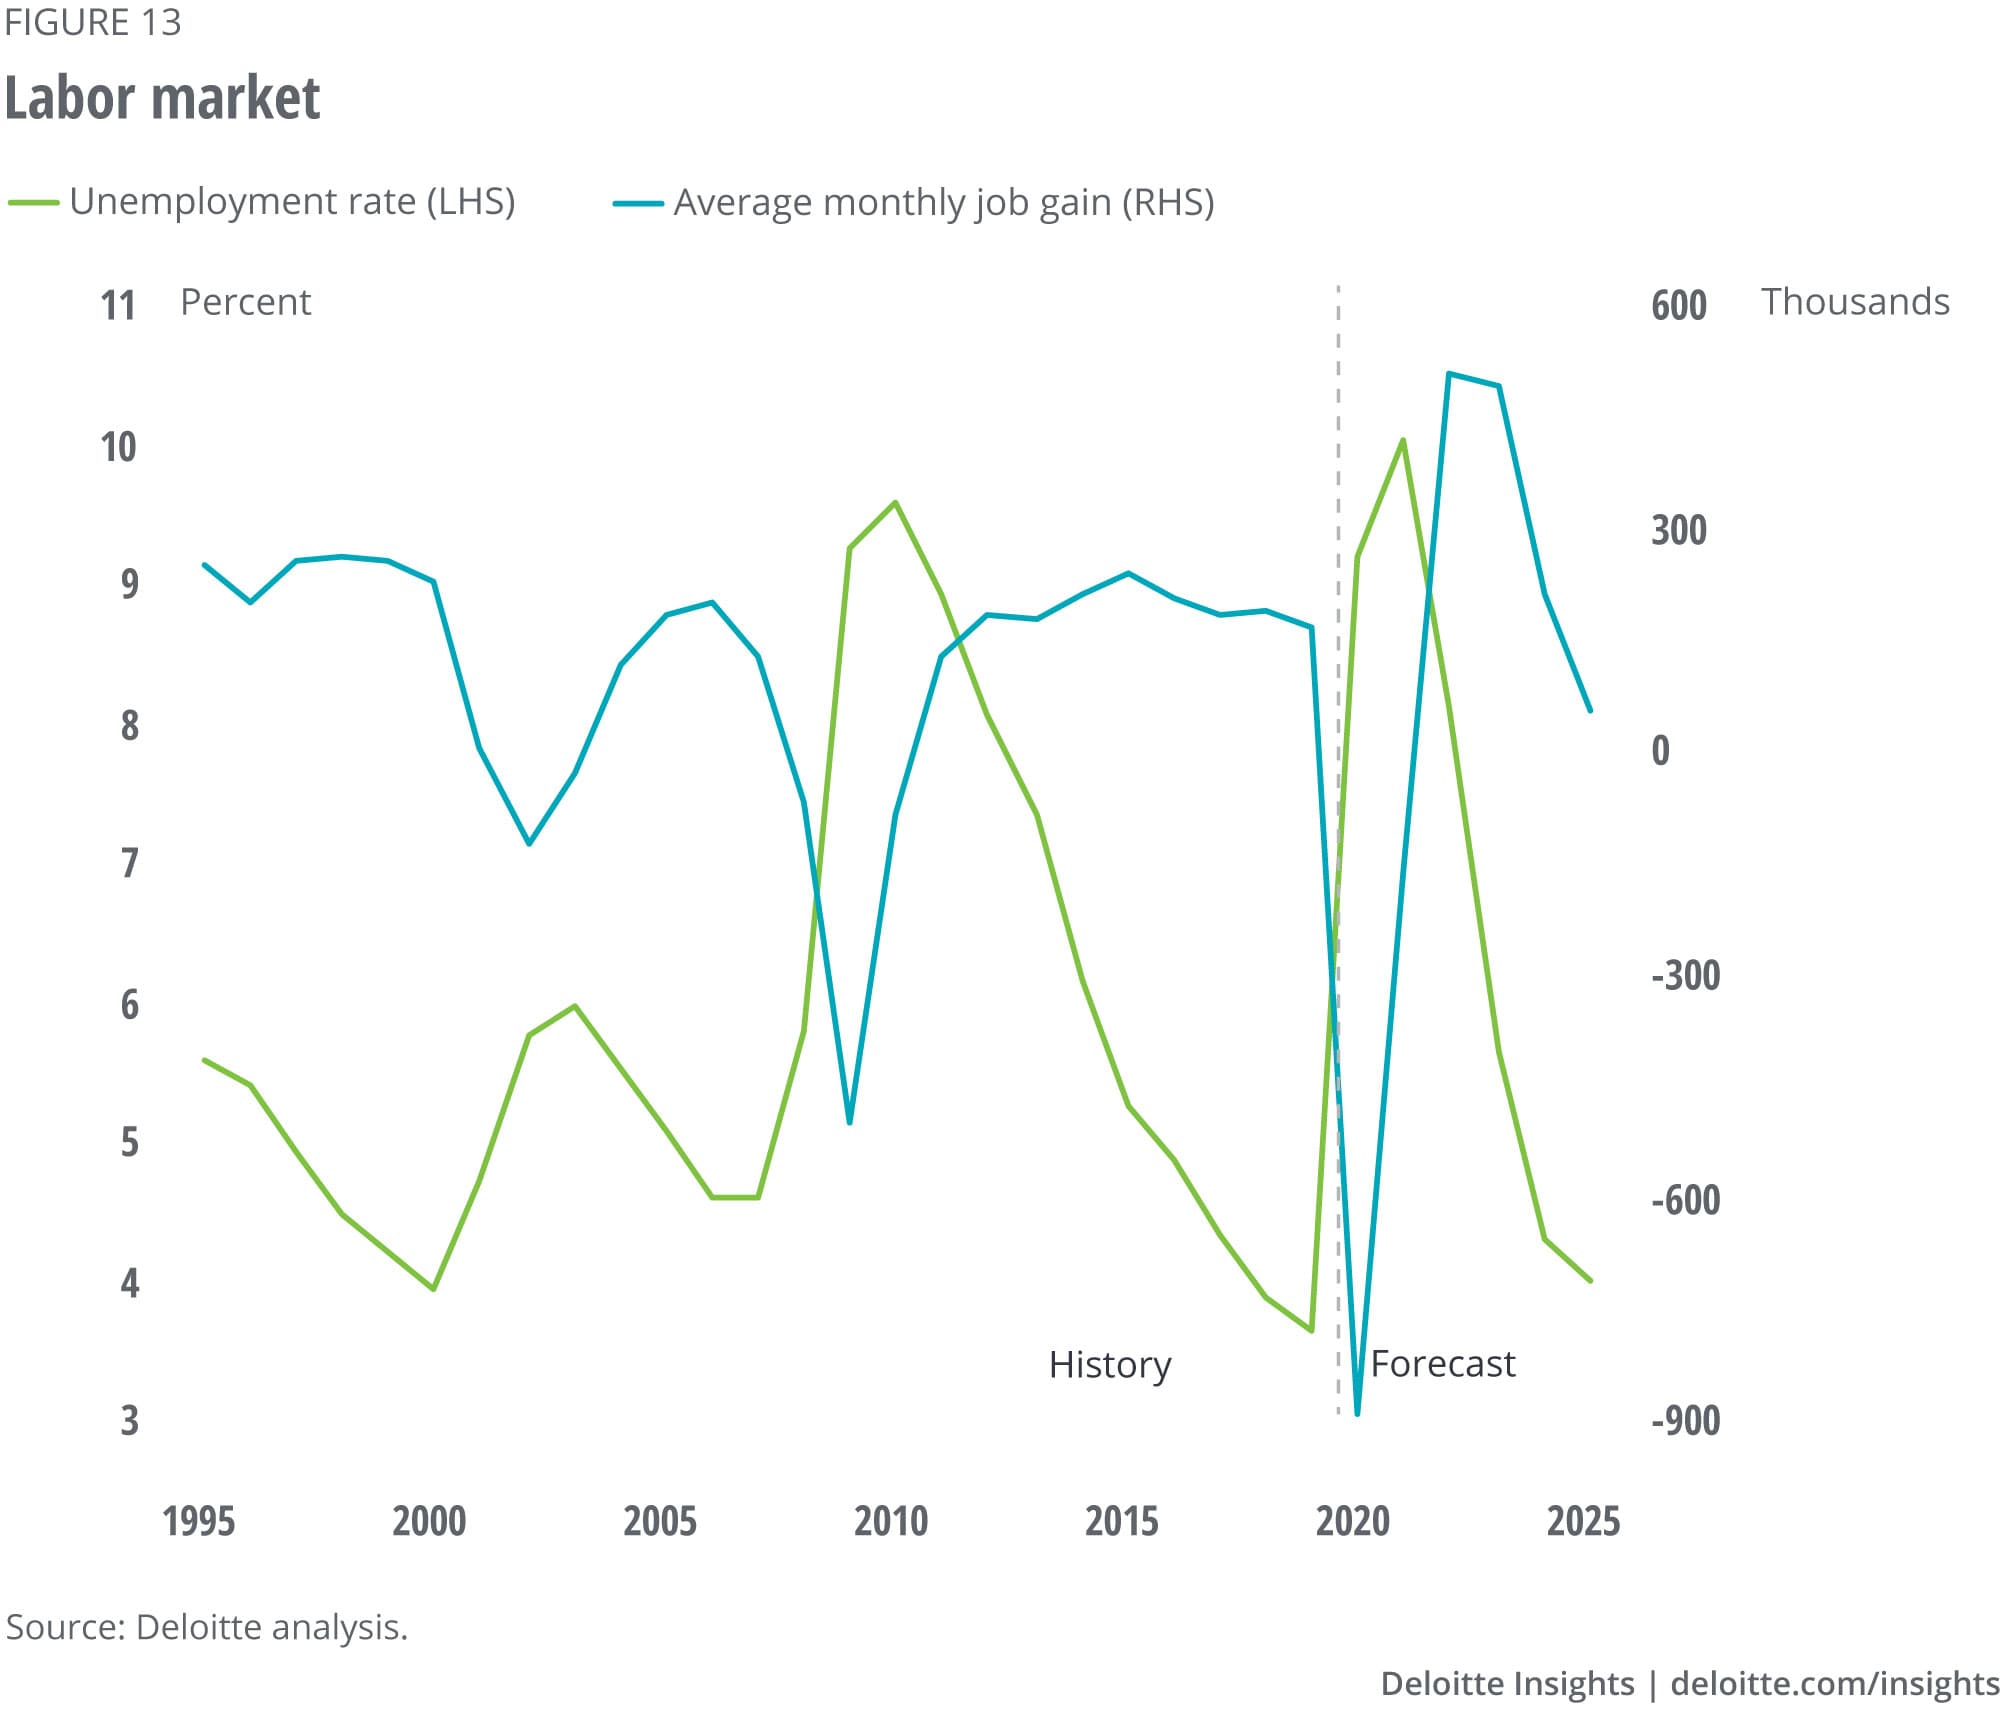
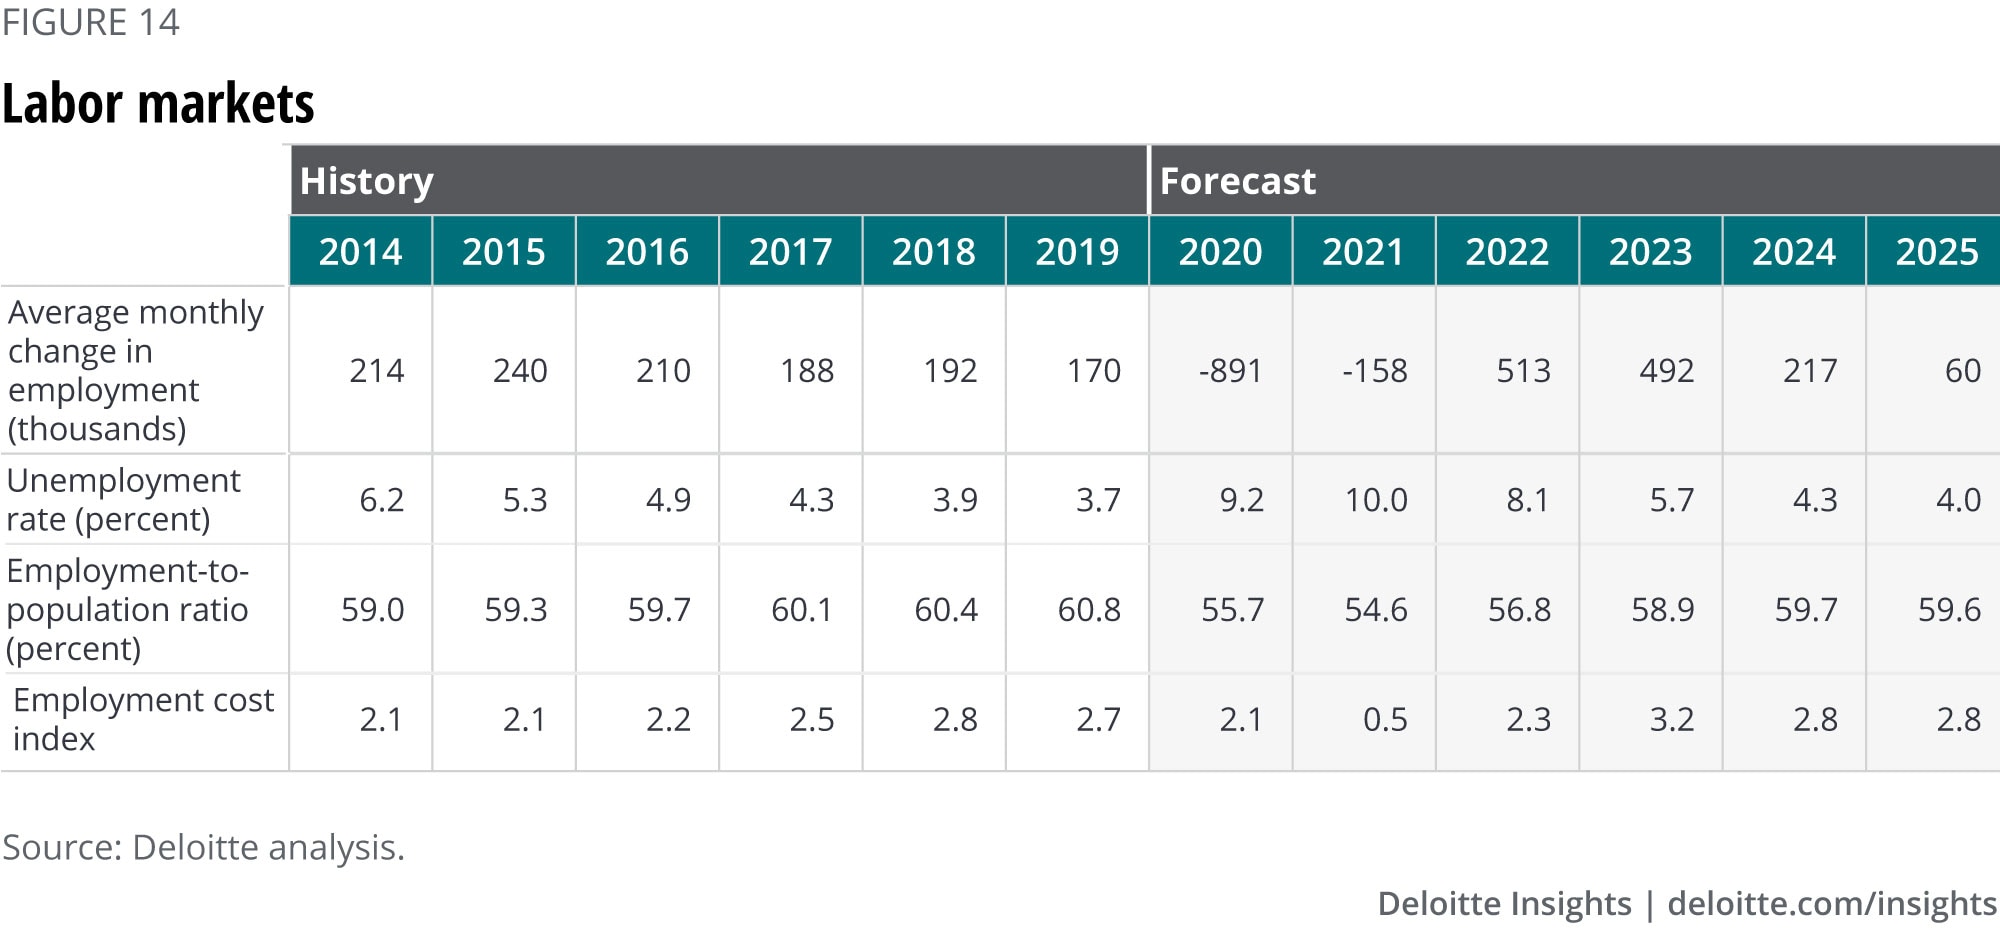
The great layoff of April 2020 saw employment plunge by more than 20 million, with most industries suffering a decline of more than 10%. Half of everyone working in arts, entertainment, and recreation and in food services and accommodation was laid off. That’s a massive hole. Enhanced unemployment insurance softened the income blow quite a bit—by some estimates, UI payments made up half the total lost personal income of the unemployed in April.16 And the spring and early summer saw 9 million jobs come back, which is undeniably impressive. But the big employment gains may be at an end.
As long as the disease remains a significant issue, demand in the most affected industries will continue to lag. That means that many people who were employed in those industries will need to seek jobs in other industries (and perhaps other occupations).
Many industries will feel the drop in spending with the end of the UI supplement and the need for state and local austerity. The multiplier effect of this decline will offset any improvement from a reduction in the disease.
State and local governments will need to cut spending—a lot. As high unemployment and slower economic activity translate to lower tax revenues, governments will have to cut back on spending. And much of that spending pays salaries of state and local workers, ranging from building inspectors to police officers. Our baseline forecast assumes that the number of people employed by state and local governments falls by about 1 million by late 2021 (beyond the 500,000 decline in the second quarter), although we also assume that most of those workers will be rehired in 2022.
Businesses will still be looking for people—but in different industries and occupations. Efforts to reshore parts of the supply chain, and to build more robust manufacturing systems, will likely mean that jobs will become available in manufacturing and related industries. How to entice people to switch to manufacturing from, say, food service, and accommodation? The lack of opportunities in the old areas will help, but many businesses in manufacturing may need to invest substantial effort—and perhaps higher wages—to attract workers, even as unemployment remains high.
Such labor market adjustments are usually slow to occur, one reason why we expect the overall economic recovery to be relatively slow. Promoting more efficient labor markets might help to speed the recovery—but it would mean admitting that the pre-pandemic economy will never return. That might be a hard pill for workers and policymakers to swallow.
Financial markets
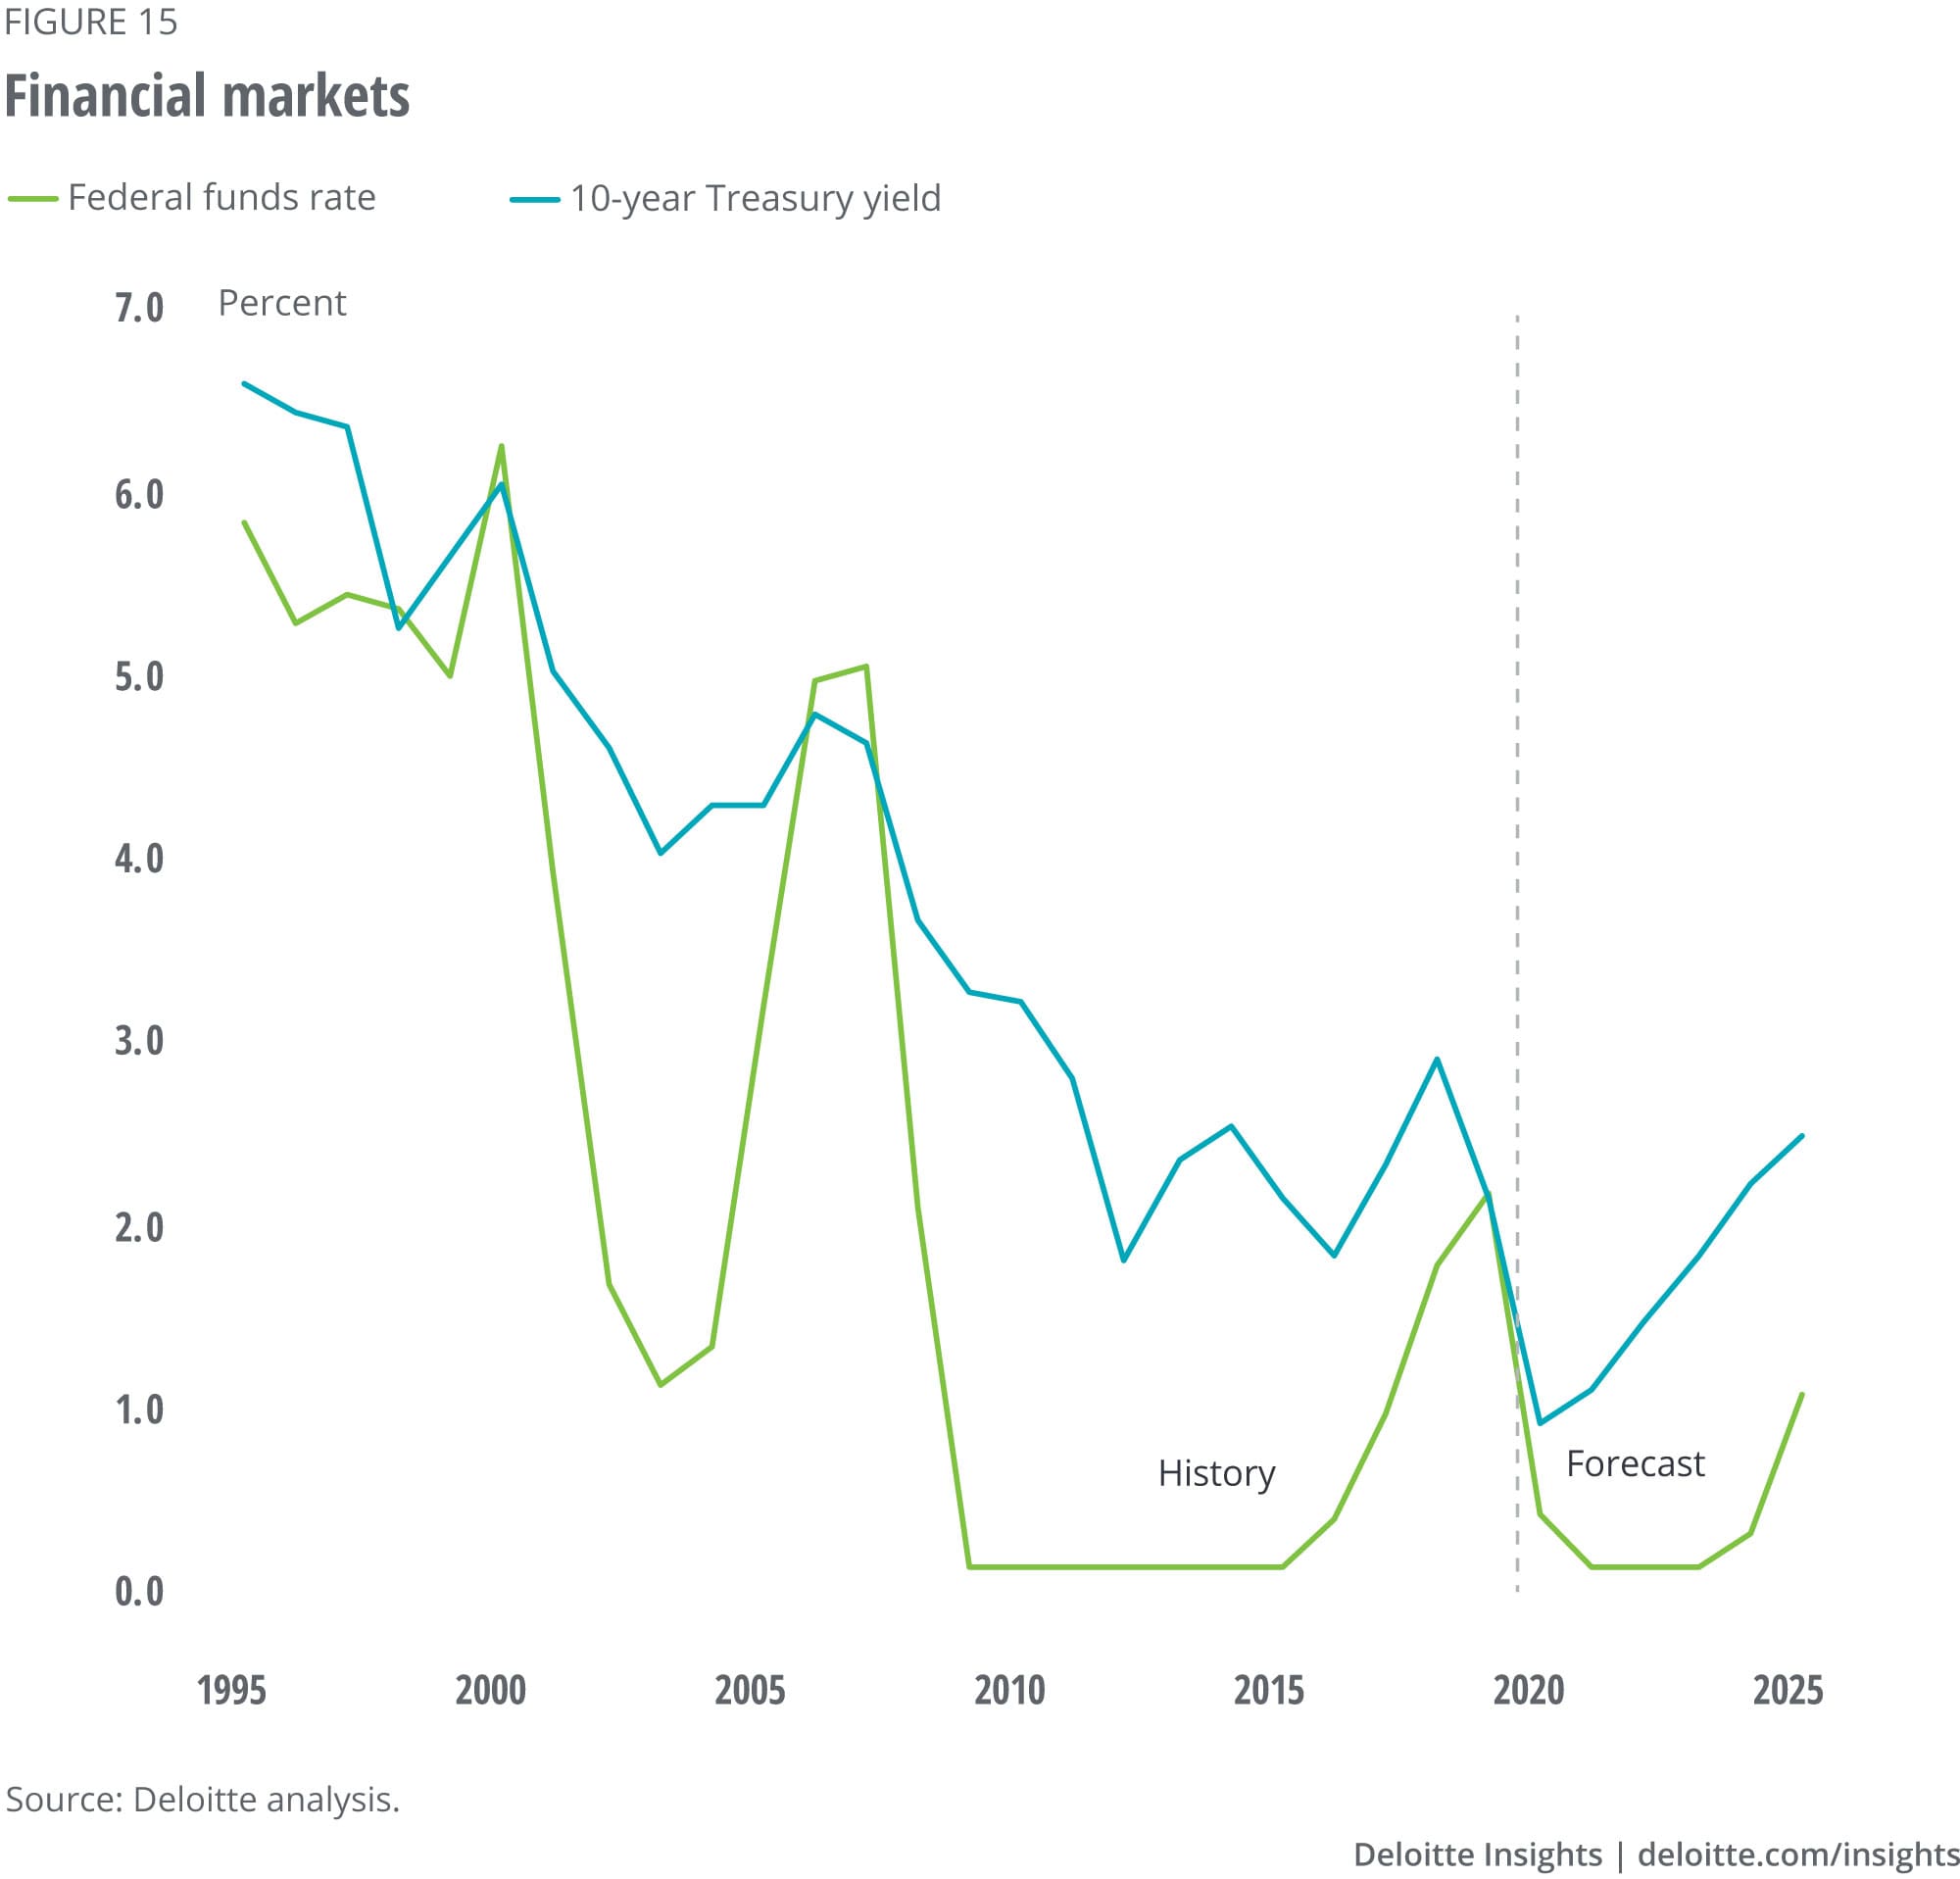
The Fed’s operations have been one of the bright spots of the response to the pandemic. When the disease first began spreading in the United States, there was a significant possibility that a financial market meltdown could have added to the country’s economic problems. The Fed’s prompt and strong actions kept financial markets liquid and operating, preventing that additional level of pain.
There was a cost, of course: the Fed’s intervention in many different markets. The traditional concerns about the Fed buying private assets have gone out the window, and the Fed has created methods for direct lending from US states, counties, and cities (Municipal Liquidity Facility), small and medium-sized businesses (Main Street Lending Program), and purchases of corporate bonds (Primary and Secondary Corporate Credit Facilities).17 This is unprecedented: The Fed has traditionally avoided lending directly, avoiding the complications of dealing with nonfinancial firms. Other programs are aimed at stabilizing specific financial markets. Although the volume of lending for many of these facilities is still at a small fraction of the announced level, the Fed’s willingness to lend has calmed credit markets.
But there is a limit to what the Fed can do. The Fed can keep financial markets operating, provide liquidity for markets, and even lend directly to companies so that they don’t shut down. But it can’t maintain the incomes of unemployed people, or lend to state and local governments, or fund necessary health care spending. That’s why Fed Chairman Jerome Powell has emphasized the importance of action by Congress and the president.18 As he points out, the Fed has “lending, not spending, powers.” It would be foolish to expect Fed action alone to solve this economic crisis.
In the longer term, the Fed will want to wean markets off of its aid. But this is likely several years away. And since sales of these assets will precede hiking the Fed funds rate, we have assumed that the funds rate remains near zero over the five-year forecast horizon. We do assume a slow rise in long-term interest rates as financial markets “normalize.” But that leaves the 10-year Treasury yield at 2.5% by 2025. Interest rates are always the least certain part of any forecast: Any significant news could, and will, alter interest rates significantly.
Prices
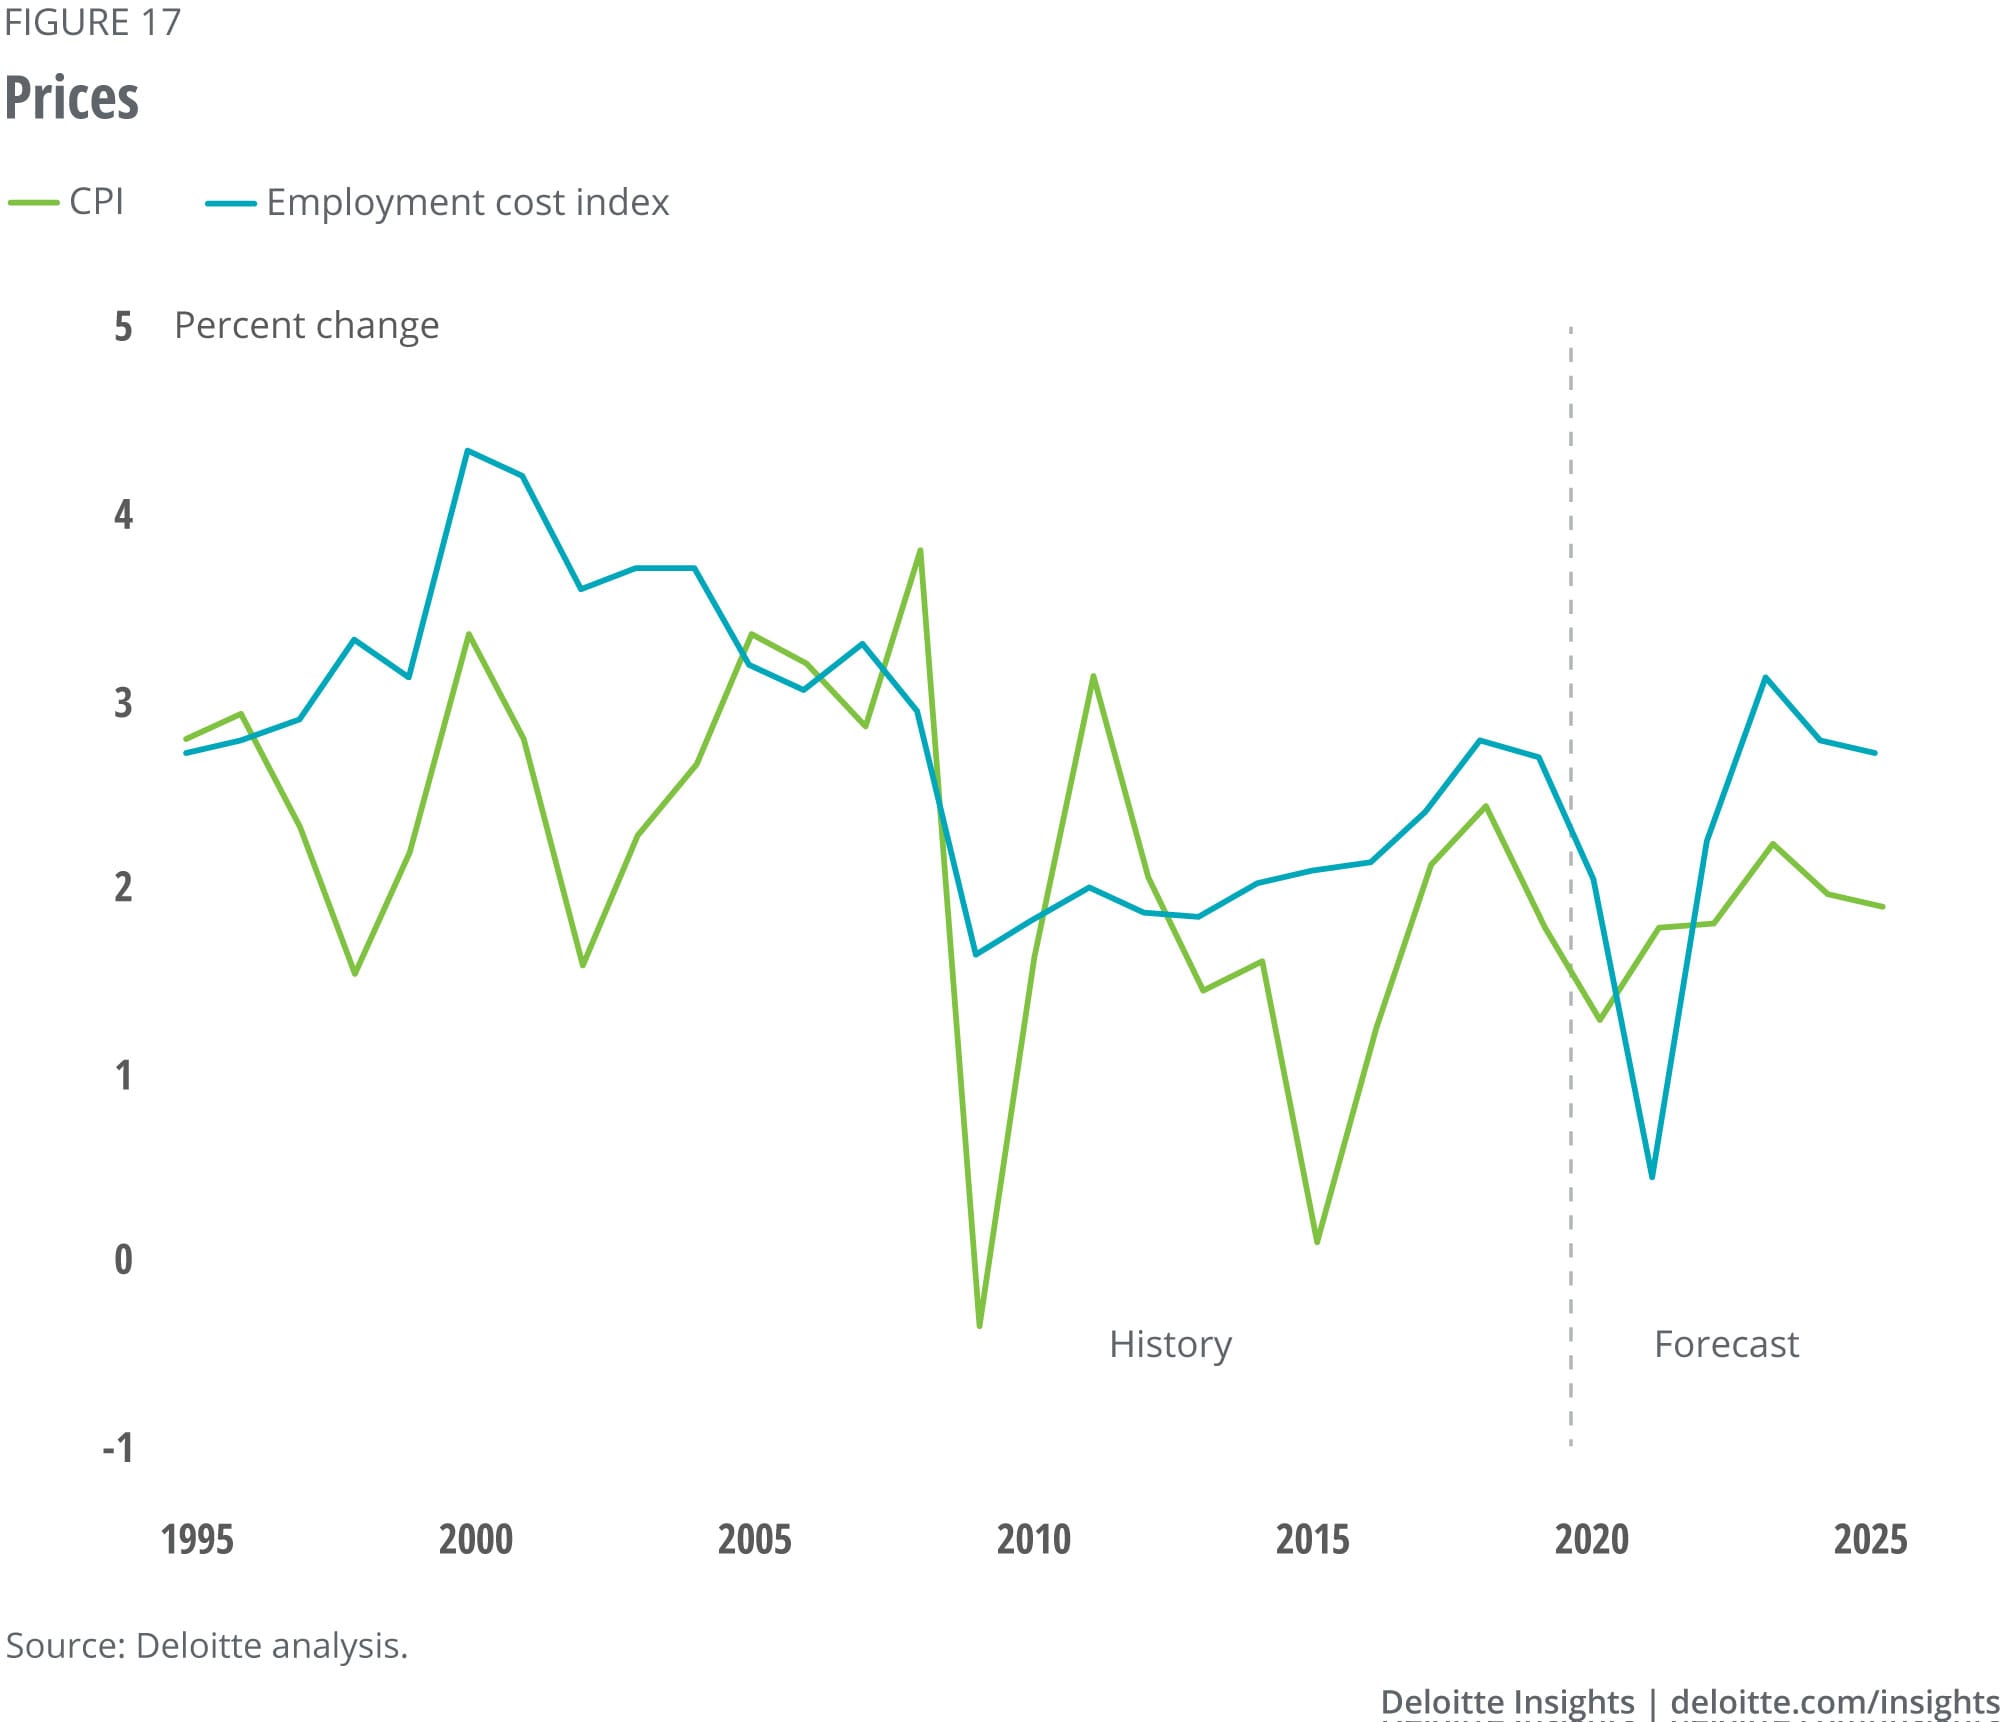
Shutting down much of the US economy to fight COVID-19 might be expected to raise prices, with supply chains strangled. And it might be expected to lower prices, with consumer demand crashing. Which has happened?
The supply shock of the pandemic has clearly raised certain prices. The consumer price index for food at home rose 2.6% in April as supply chain problems caused spot shortages for consumers. That’s a short-term impact, but there are likely to be some significant long-term impacts. For example, requirements for cleaning and social distancing are likely to raise prices of restaurant meals, airplane travel, schooling, and many services—such as day care—over the next year. Firms in areas such as these will not only be faced with higher costs—they will lose the ability to exploit economies of scale. Added to that, businesses are likely to adopt practices such as larger inventories to reduce their vulnerability to shocks. Those practices will also raise prices—and reduce productivity.
On the other hand, the demand shock has begun to drive down some prices. That’s been most evident in energy, where the consumer price index fell 10.1% in April after dropping 5.8% in March. April consumer gasoline prices fell below US$2 per gallon. That might have made for happy motorists, except that miles driven also fell—in fact, that was a key driver of low gasoline prices. Prices of apparel fell in April, unsurprising given an almost 80% drop in sales. In the baseline forecast, we expect overall demand to remain low, both because of the pandemic and because so many people are out of work. That will likely result in some significant discounting over the next year.
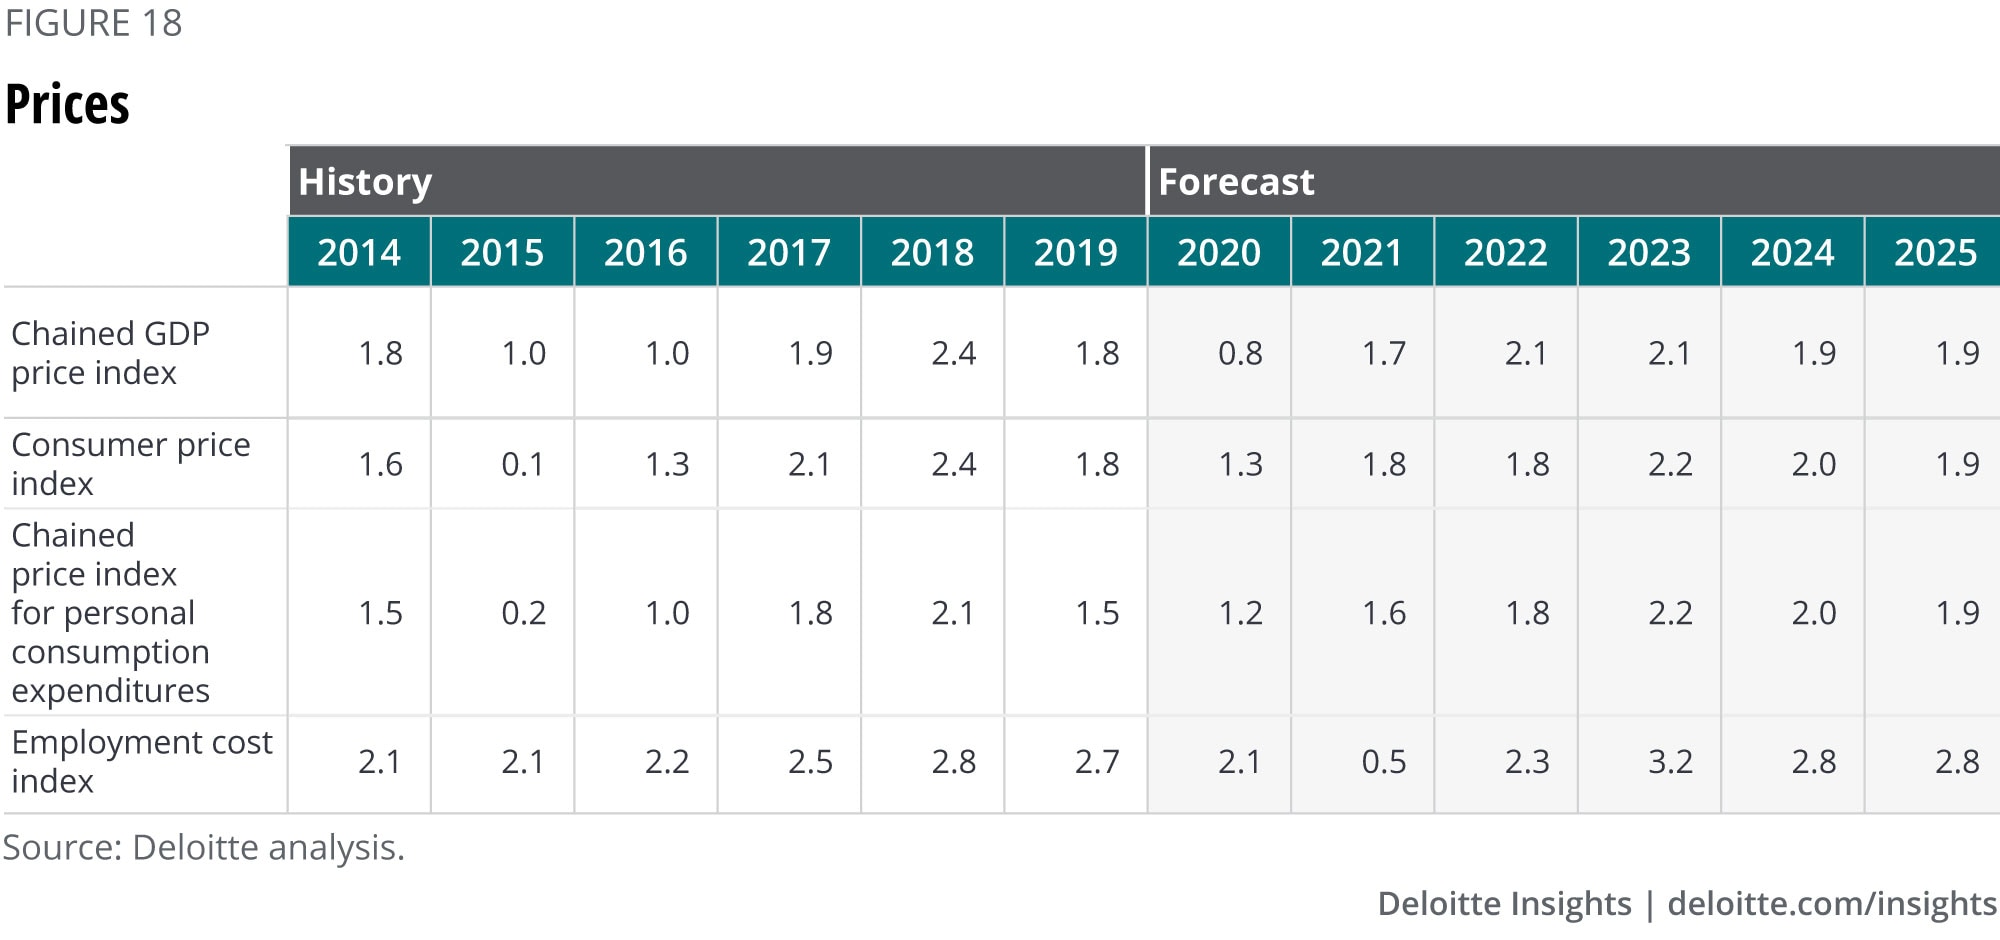
The battle between supply and demand will likely continue through the forecast horizon. In a world of high unemployment, businesses will have little pricing power but will face higher costs. Given these offsetting factors, the baseline forecast calls for inflation to continue at about 2.0% over the forecast horizon.
Appendix
More from the Economics collection
-
Japan economic outlook, October 2024 Article1 month ago
-
A view from London Article2 days ago
-
Asia’s economic recovery Article4 years ago
-
The long and short of short-time work amid COVID-19 Article4 years ago
-
Canada Economic Outlook Article4 years ago


