
Housing America: A forecast of housing construction in the United States Economics Spotlight, February 2019
5 minute read
01 March 2019
The US housing sector is weakening after its recovery from the Great Recession. In this article, we forecast housing starts based on some long-term fundamental factors.
Any talk about the US housing sector slowing still sends a shiver down many spines. This is usually followed by anxious thoughts of a potential economic downturn—such has been the impact of the Great Recession. However, association of ideas, while natural, can also be misleading. The Great Recession was not caused by housing itself but by housing finance—an important nuance that is likely to calm a few nerves.1
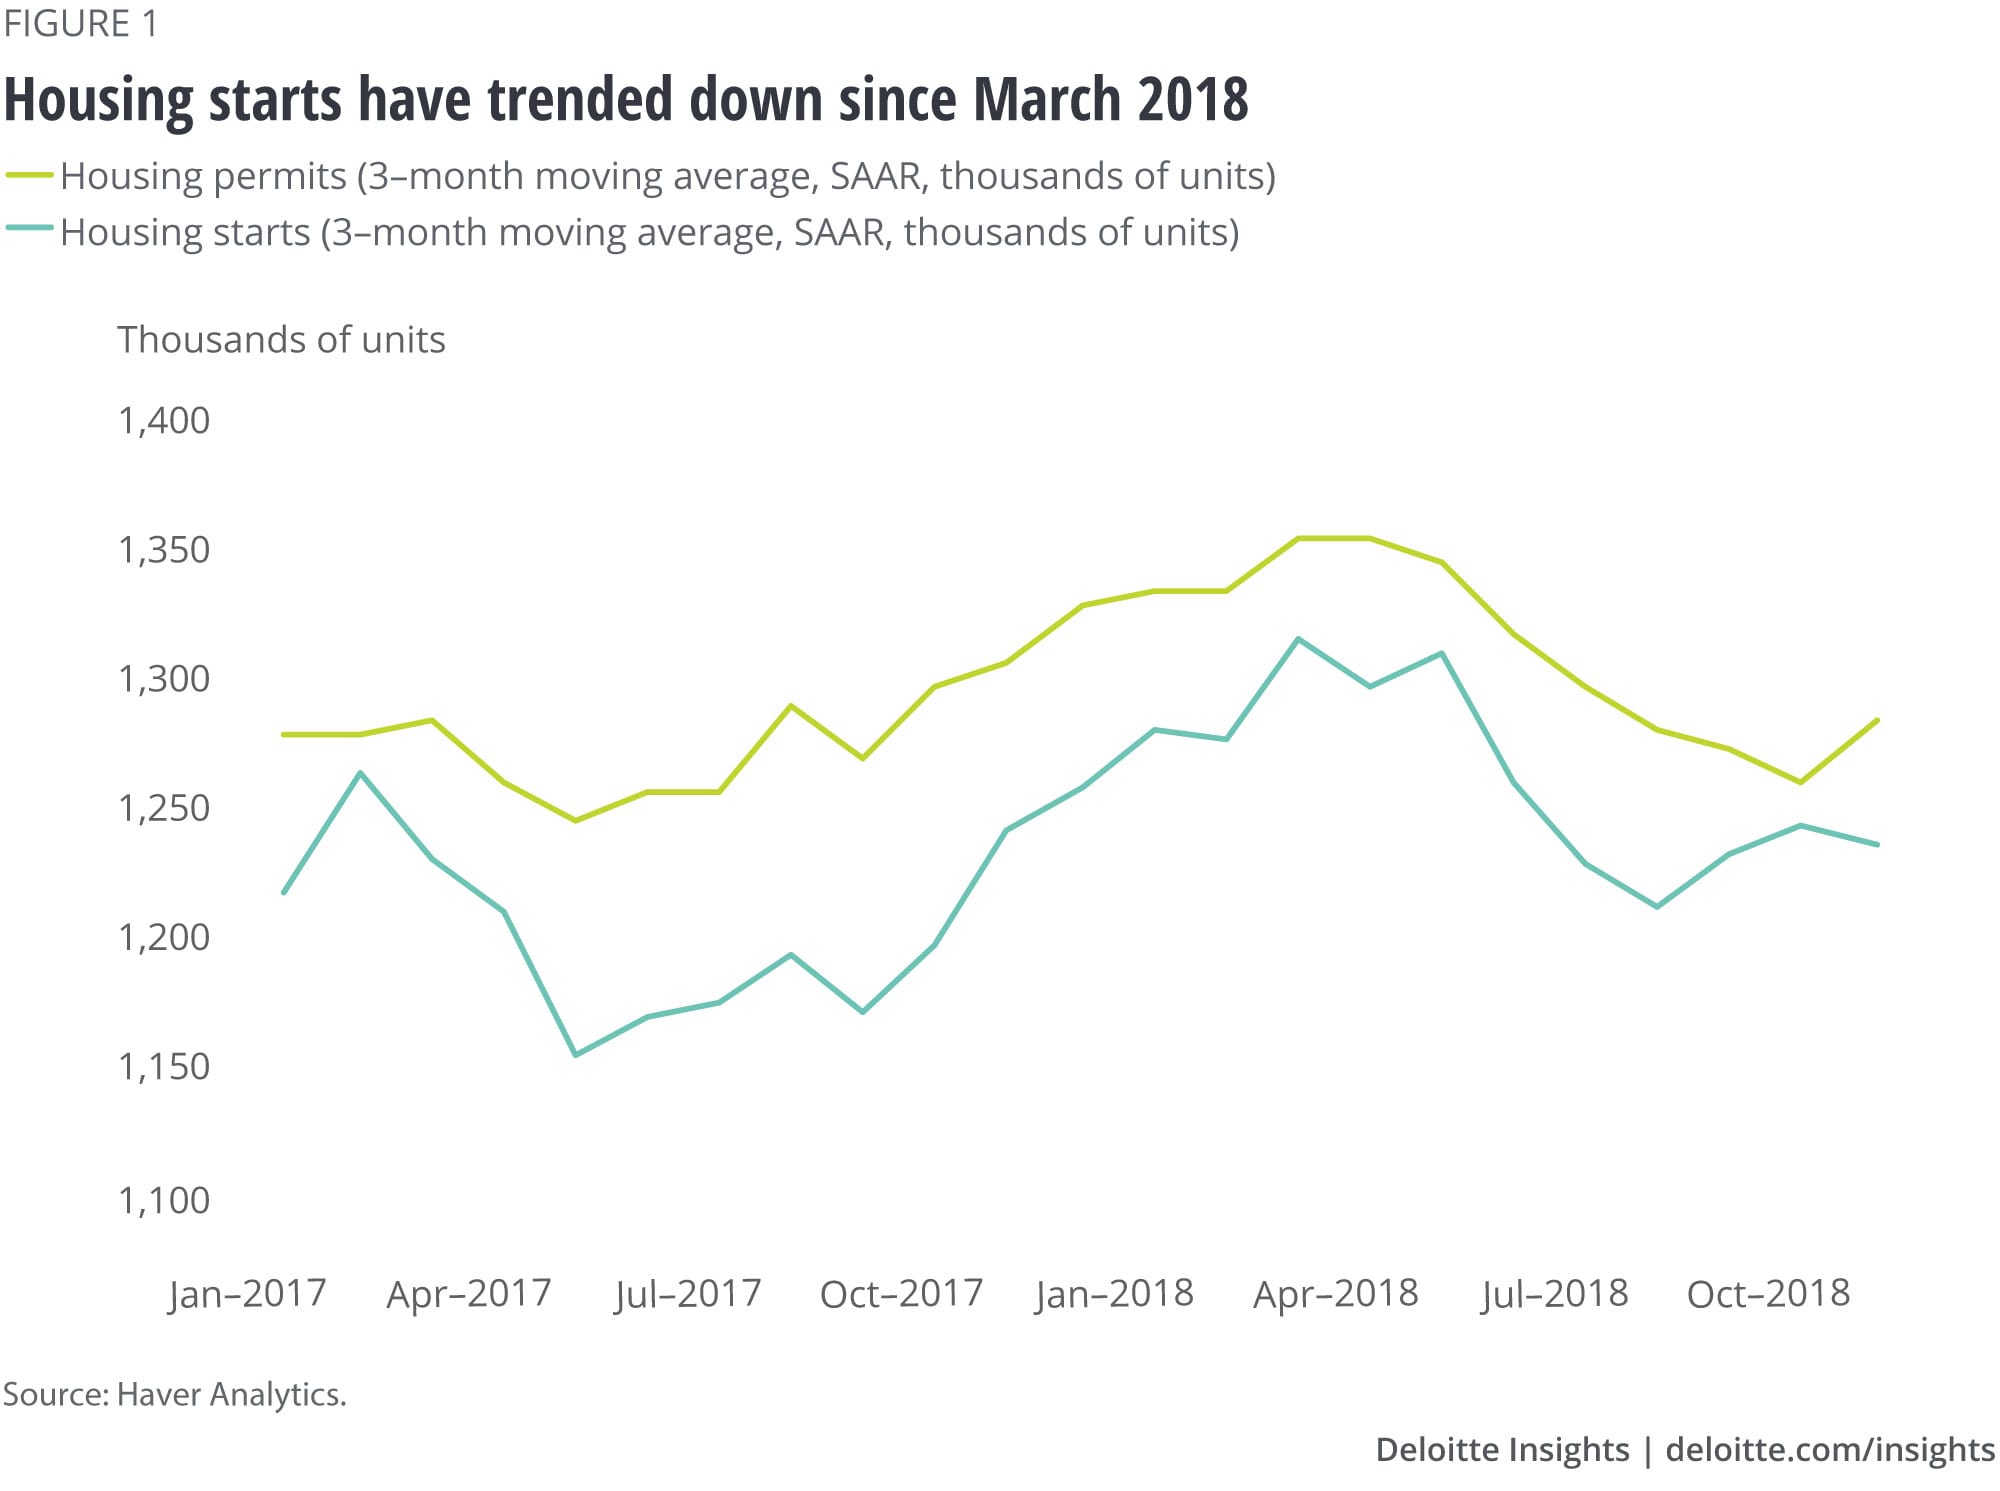
Yet, the housing sector in the United States has indeed weakened. In fact, we might have already seen the best of the housing recovery post the collapse during 2007–20092—the three-month moving average of housing starts indicates a slowdown since March 2018. Housing permits, an indicator of future starts, have also slowed since March (see figure 1). Fewer housing units constructed means weaker demand for building materials. It also translates into fewer housing units sold, which, in turn, will likely affect sales at furniture and home furnishing stores. How is housing construction likely to play out in the near to medium term?
In this article, we revisit an earlier projection of housing construction (from four years ago).3 Our model of the housing sector forecasts housing starts based on long-term fundamental factors—population, average size of an American household, depreciation of housing stock, and housing vacancy ratio (see sidebar, “Deloitte’s housing starts forecast model”).
Projecting housing starts over the next five years
Our model of the housing sector considers the total stock of housing—this includes occupied housing units and vacant housing units. The total stock of housing changes depending upon the flow or rate of housing demand. Housing demand is partially met by existing vacant housing units, while excess demand leads to housing starts (which we forecast).
Deloitte’s housing starts forecast model
We use the following data series as input in the housing model:
- Resident population projection
- Total households
- Total housing stock
- Total occupied housing units
- Total vacant housing units
- Housing completions
- Housing starts
Calculating external variables
- We calculate the housing depreciation rate. Housing depreciation is the number of housing units removed from the housing stock each quarter. It is calculated as the difference between what the housing stock would have been with no depreciation and the actual housing stock. Housing stock from the previous quarter and housing completions from the current quarter are added to give housing stock without depreciation. From this total, we subtract housing stock in the current quarter to get housing depreciation. Calculating the number of units removed from the housing stock each quarter allows us to calculate the depreciation rate.
- We then calculate the vacancy ratio. This is straightforward—the vacancy ratio is the ratio of the vacant housing stock to the total housing stock. Part of the total housing stock remains vacant at any given point in time.
- We calculate the average size of a household (persons per housing unit). The average size of a household is calculated by dividing the resident population by the occupied housing stock.
Calculating internal variables
- We use housing stock data from the previous quarter, account for depreciation, and then add housing completions in the current quarter to yield total housing stock in the current quarter.
- Housing completions in the current quarter is based on a relationship to housing starts. This equation in the model is based on an arbitrary assumption.
- The occupied housing stock is calculated using projected population and the average size of a household.
- Excess demand for housing (that is, demand that exceeds vacant housing units) depends upon projected population and the vacancy ratio. Demand for housing is a flow or rate that changes the existing housing stock.
- Housing starts are set equal to excess demand for housing. This is what we forecast in the model.
As is the case in all forecasts, we made some assumptions regarding depreciation of housing stock, vacancy ratio, and the number of persons per household.
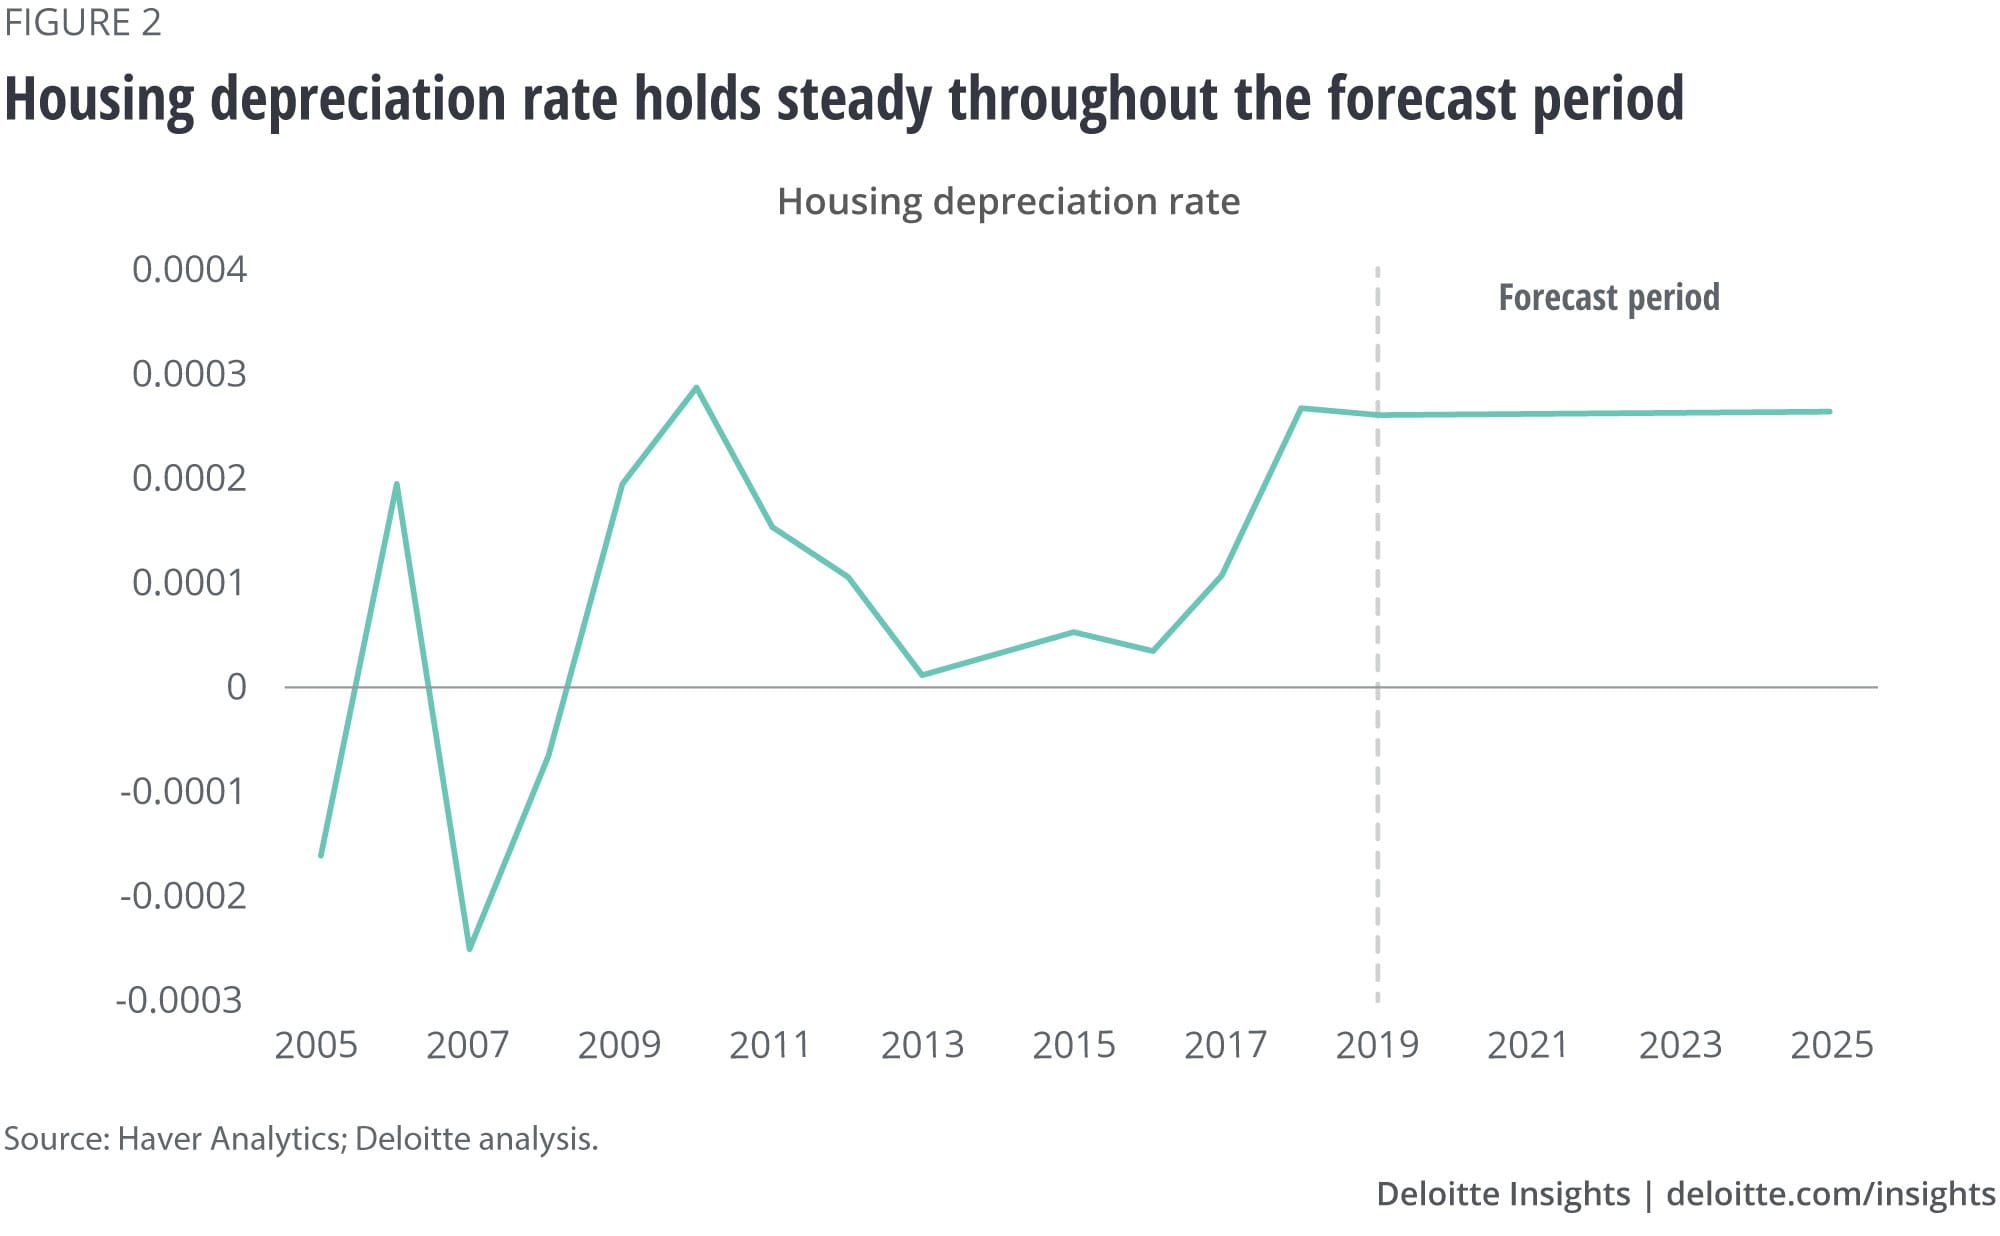
The housing depreciation rate was highly volatile until 2000. Since then, it has remained relatively stable. A gradual bounce-back in the depreciation rate since 2016 implies that more unwanted housing has been removed from the market, thereby contributing to lower vacancy rates. Our assumption is that the housing depreciation rate holds steady throughout the forecast period (see figure 2).
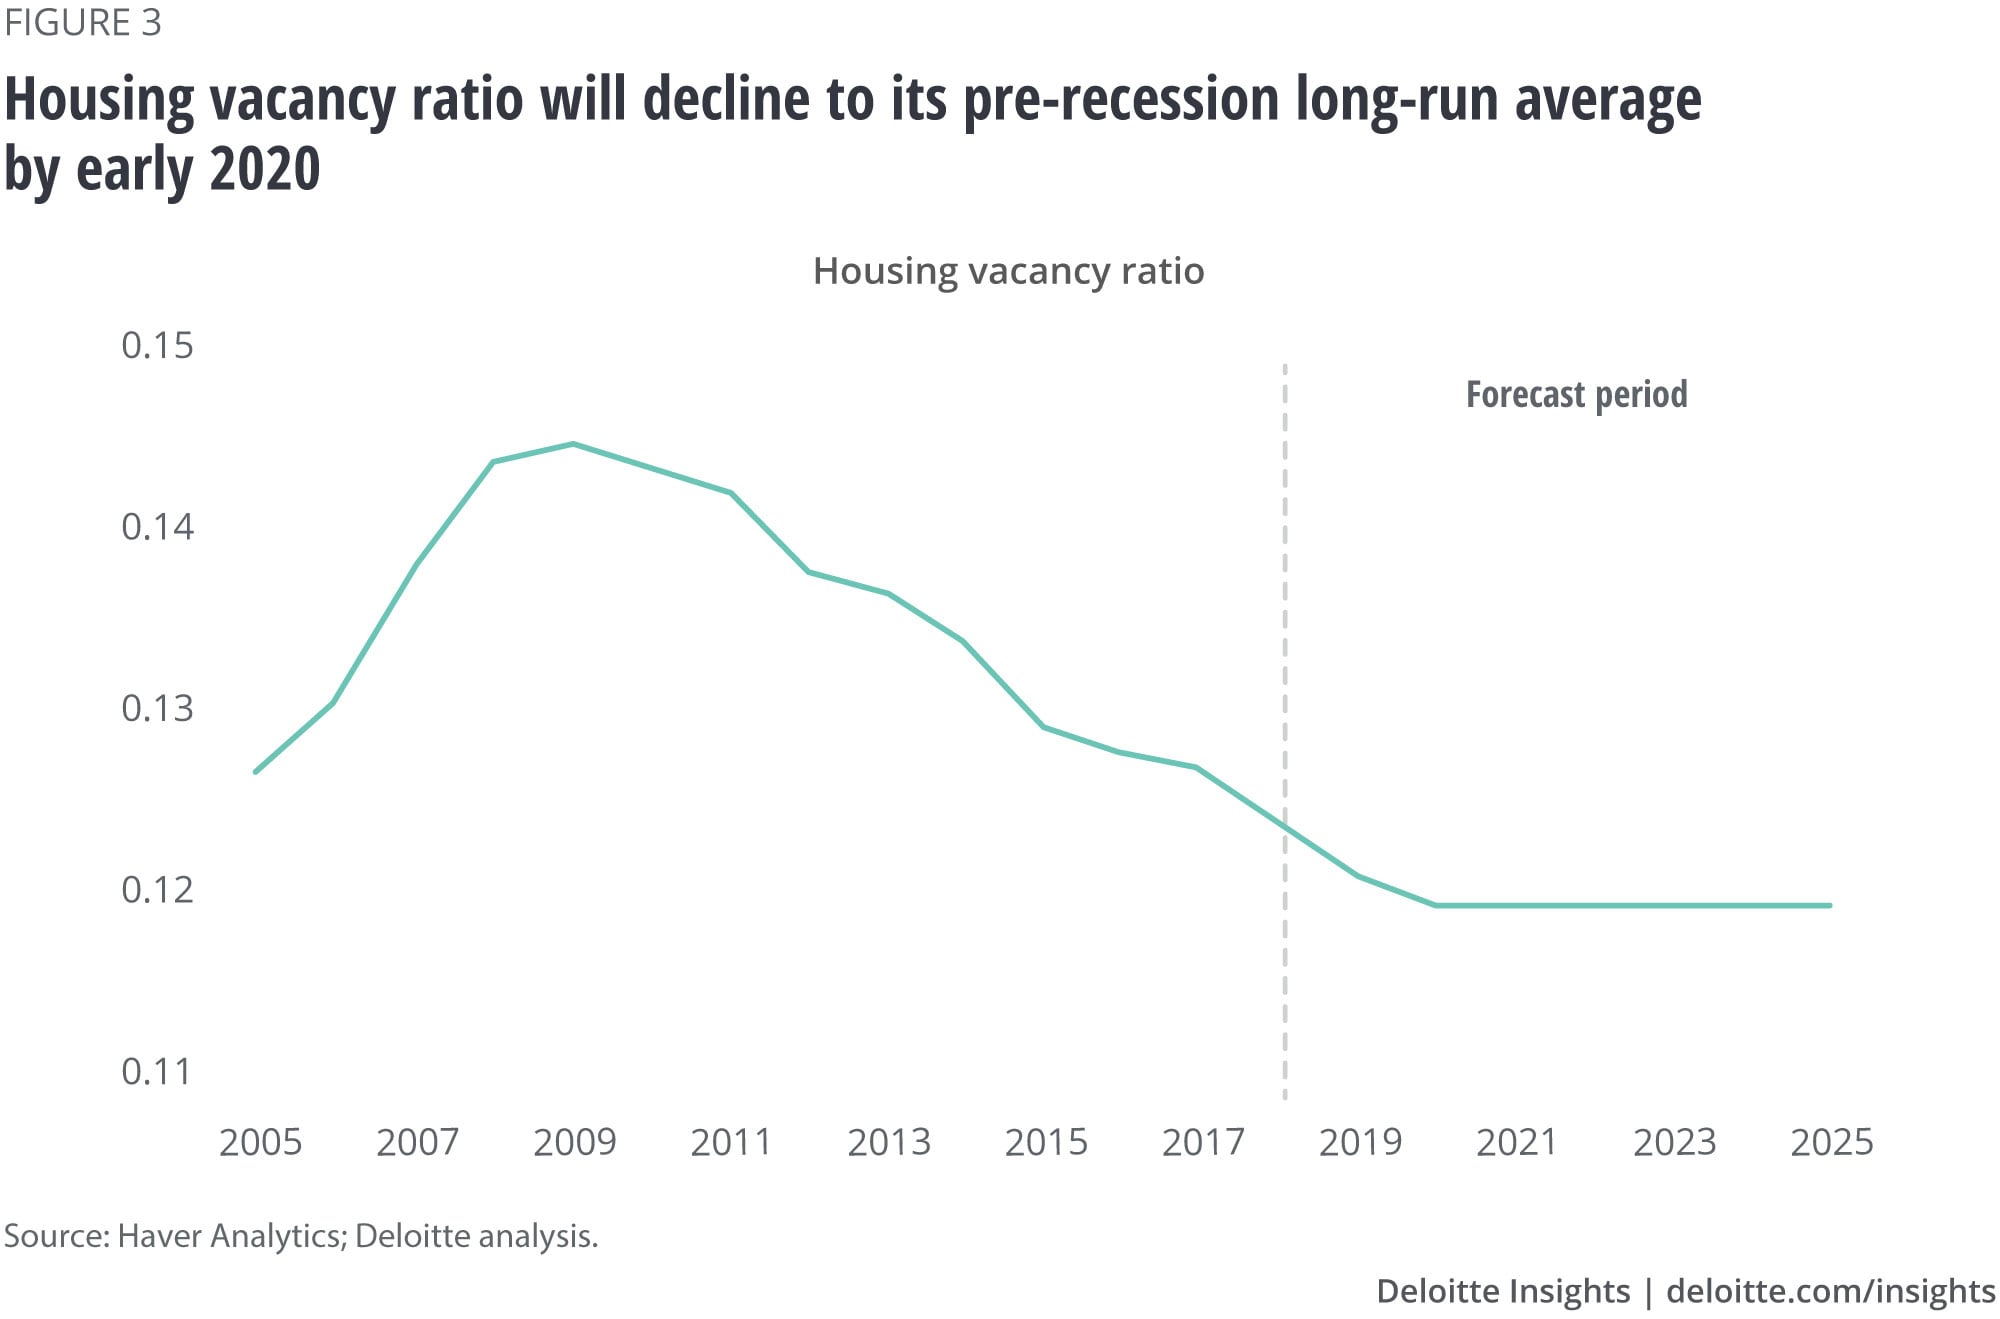
The housing vacancy ratio has been trending down since the end of 2008. We assume that the vacancy ratio will decline further to its pre-recession long-run average in the beginning of 2020 and will then hold steady through the rest of the forecast period (see figure 3). Demand for housing is partially serviced by existing vacant units. Excess demand (demand that exceeds the assumed vacancy ratio) results in new construction.
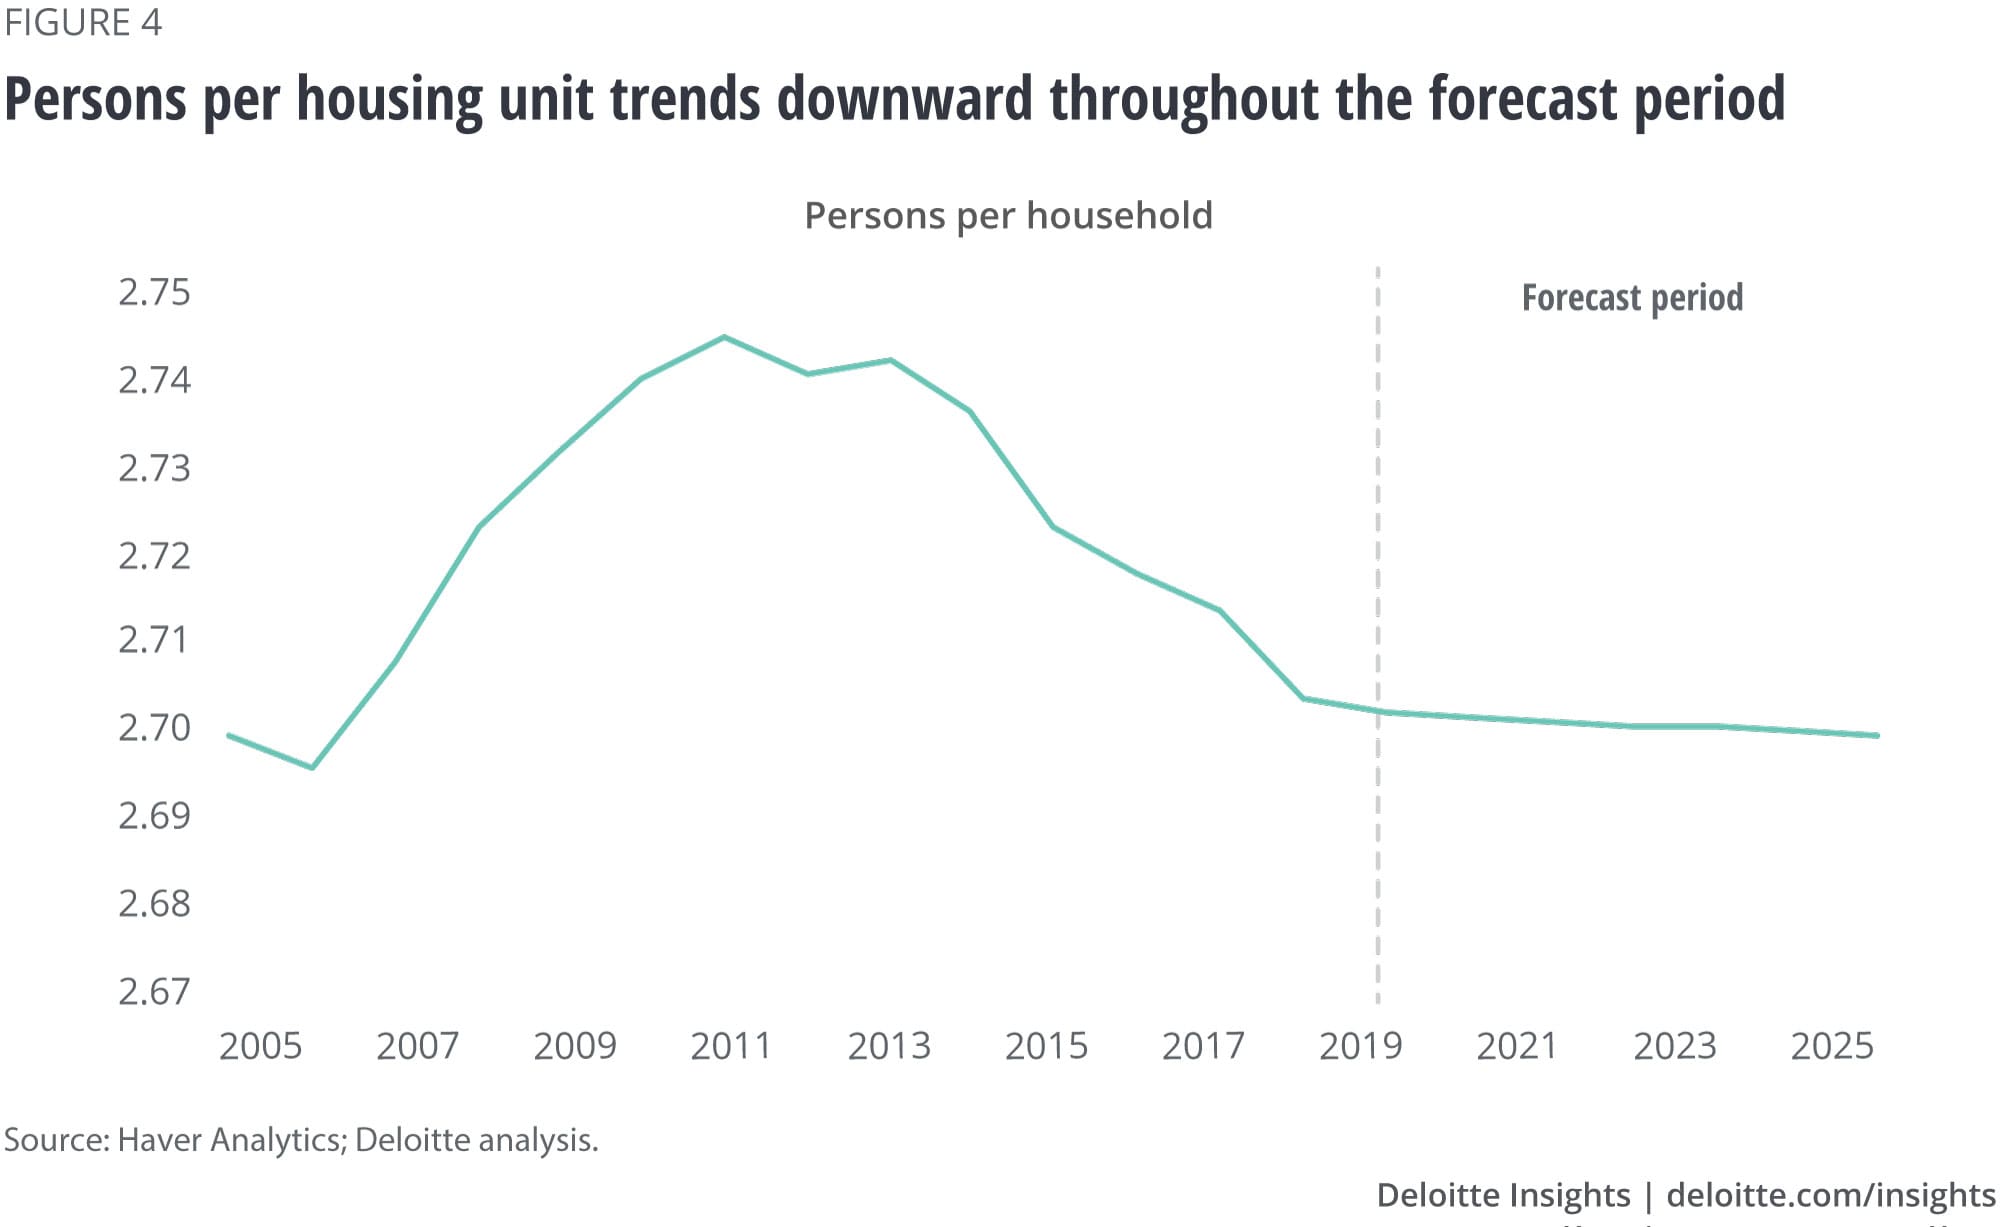
The size of the American household has been on a long-term downward trend. A slight increase from 2005 to 2014 was followed by a return to the downward trend. We assume that persons per housing unit will decline by ten-thousandth of a percentage point each quarter throughout the forecast period (see figure 4). This reflects the likely increase in the number of single-member households in the United States—aging Americans are most likely to contribute to this trend.4
Housing starts are likely to slow in the near term before bouncing back
Our model shows that housing starts are likely to dip in 2019 before gradually recovering until 2022. Starts are then projected to hold relatively steady until 2025 (see figure 5). The initial drop in starts is primarily because existing vacant housing units are likely to cater to some part of demand for housing (arising due to population growth). According to the model, the bounce-back in housing starts takes place after the vacancy ratio decreases to its prerecession long-run average. A decrease in the number of persons per household also provides a boost to housing construction. The average seasonally adjusted annual rate for housing starts during the forecast period is 1,053 thousand units, higher than the average of 916 thousand units during the recovery from 2009 to 2018 but lower than the average of 1,547 thousand units during the recovery from 1990 to 2006.
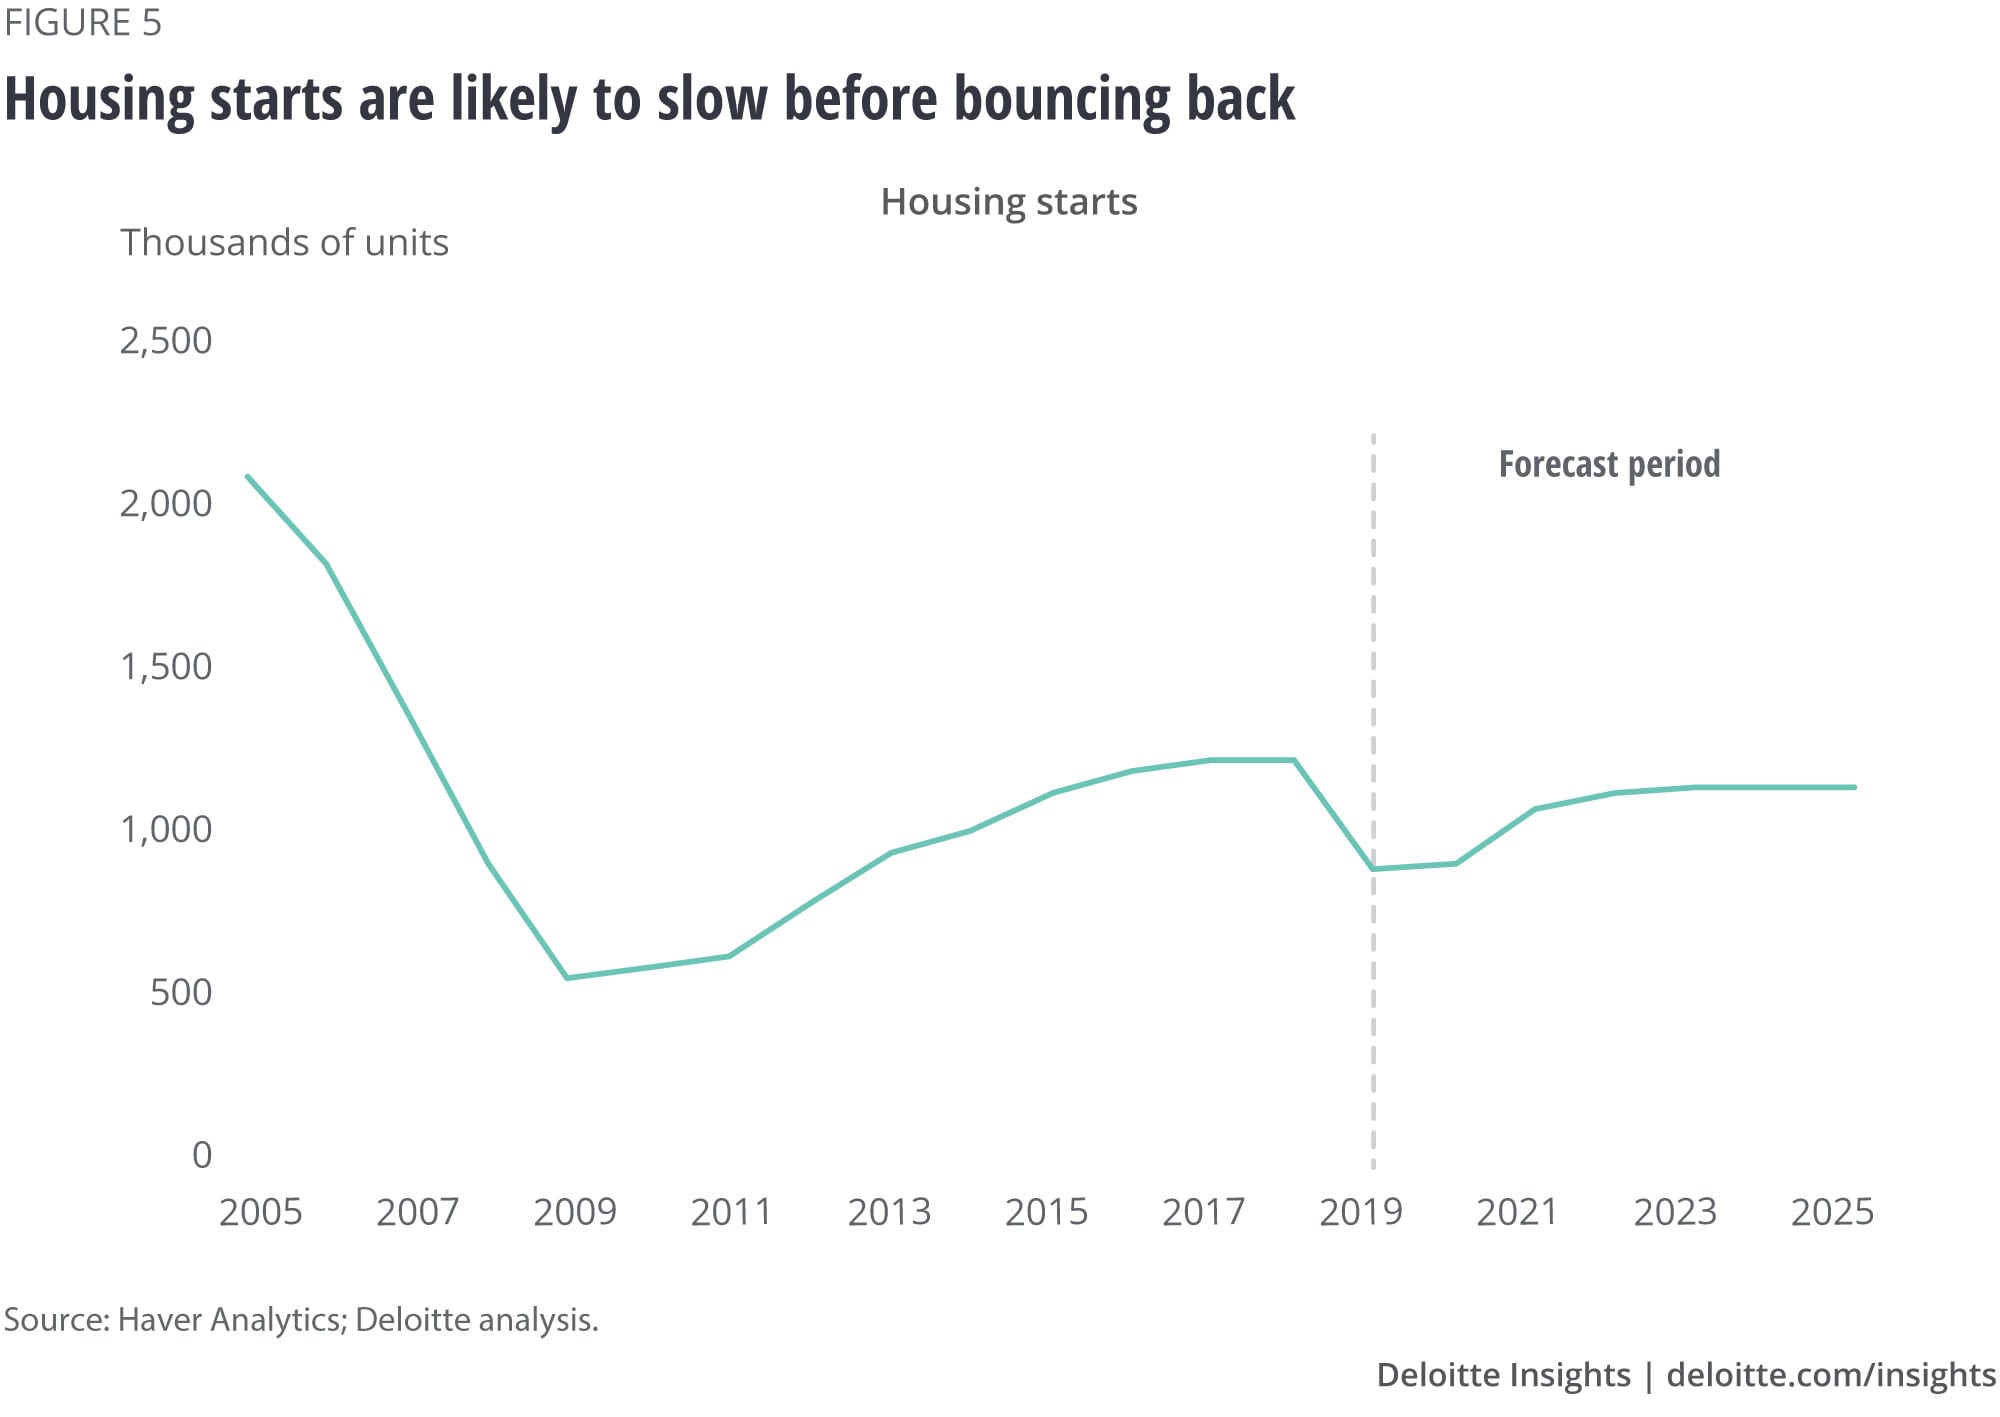
Our forecast is based on long-term fundamentals—the actual level of housing starts could deviate from the long-term trajectory due to short-term factors such as interest rates and employment. Nevertheless, a fall in housing starts in the near term is unlikely to pose any major threat to the wider economy. The housing sector accounts for a smaller share of total GDP than it did before the Great Recession. As Deloitte’s quarterly economic forecast points out, it just isn’t large enough to cause a recession unless hidden bets on housing prices suddenly unravel.5
© 2021. See Terms of Use for more information.
Explore more in Economics Spotlight
-
Get ready—federal borrowing is about to make corporate debt more expensive Article6 years ago
-
Consumer spending: Understanding what it is and how it is evolving Article6 years ago
-
Why 2020 could be a dangerous year for the US economy Article6 years ago
-
Have US households adequately deleveraged? Article6 years ago
-
Trade disputes will weigh on the economy, but by how much? Article6 years ago
-
How global trade in services helps the US Article6 years ago


