
The changing balance of trade Economics Spotlight, September 2019
8 minute read
27 September 2019
The US goods trade deficit with China lessened over the first two quarters of 2019, but the overall goods deficit continued trending higher. How is US trade shifting?
Current discussions of international trade are almost exclusively focused on trade in goods and indeed, in the case of the United States, that is where the “problem” lies. In the other trade component, services, the United States runs a surplus. However, the services surplus (US$260 billion in 2018) is dwarfed by the goods deficit (US$887 billion), resulting in an overall annual trade deficit (US$628 billion).1 Since it is the goods deficit that is the focus of tariff threats and actions, here we will focus on goods trade.2
Learn more
Explore the Economics Spotlight collection
Subscribe to receive related content
Download the Deloitte Insights and Dow Jones app
As shown in figures 1 and 2, the goods trade deficit improved during the last recession, in keeping with the pattern observed during the 2001 recession. Between the trade peak in the third quarter of 2008 (which came after the start of the recession in December 2007) and the trough in the second quarter of 2009 (which matches with the end of the recession), imports fell by 35.0 percent ( US$195 billion), while exports only fell by 27.0 percent (US$92 billion).3 This combination resulted in the trade deficit in goods falling from US$215 billion to US$111 billion—a decline of about 50.0 percent.
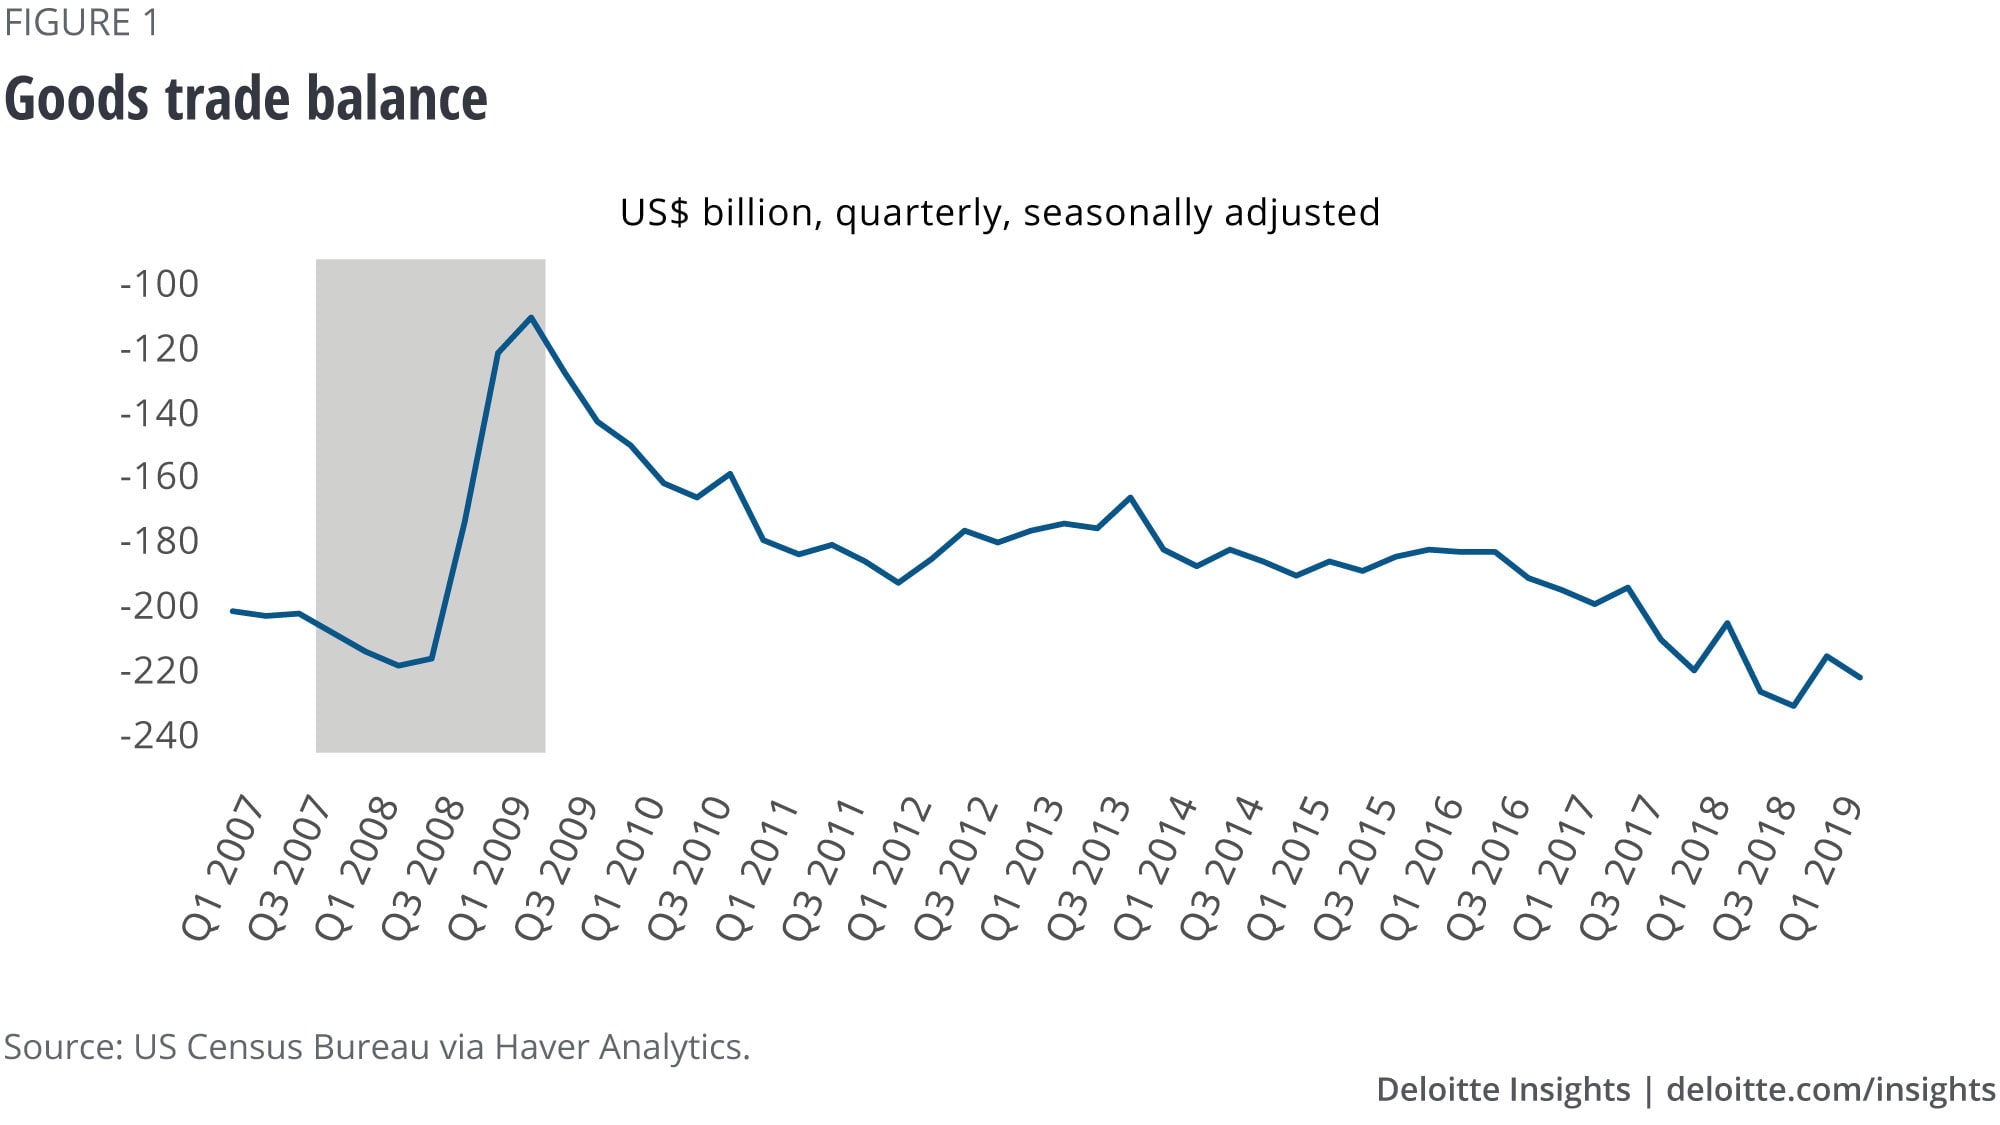
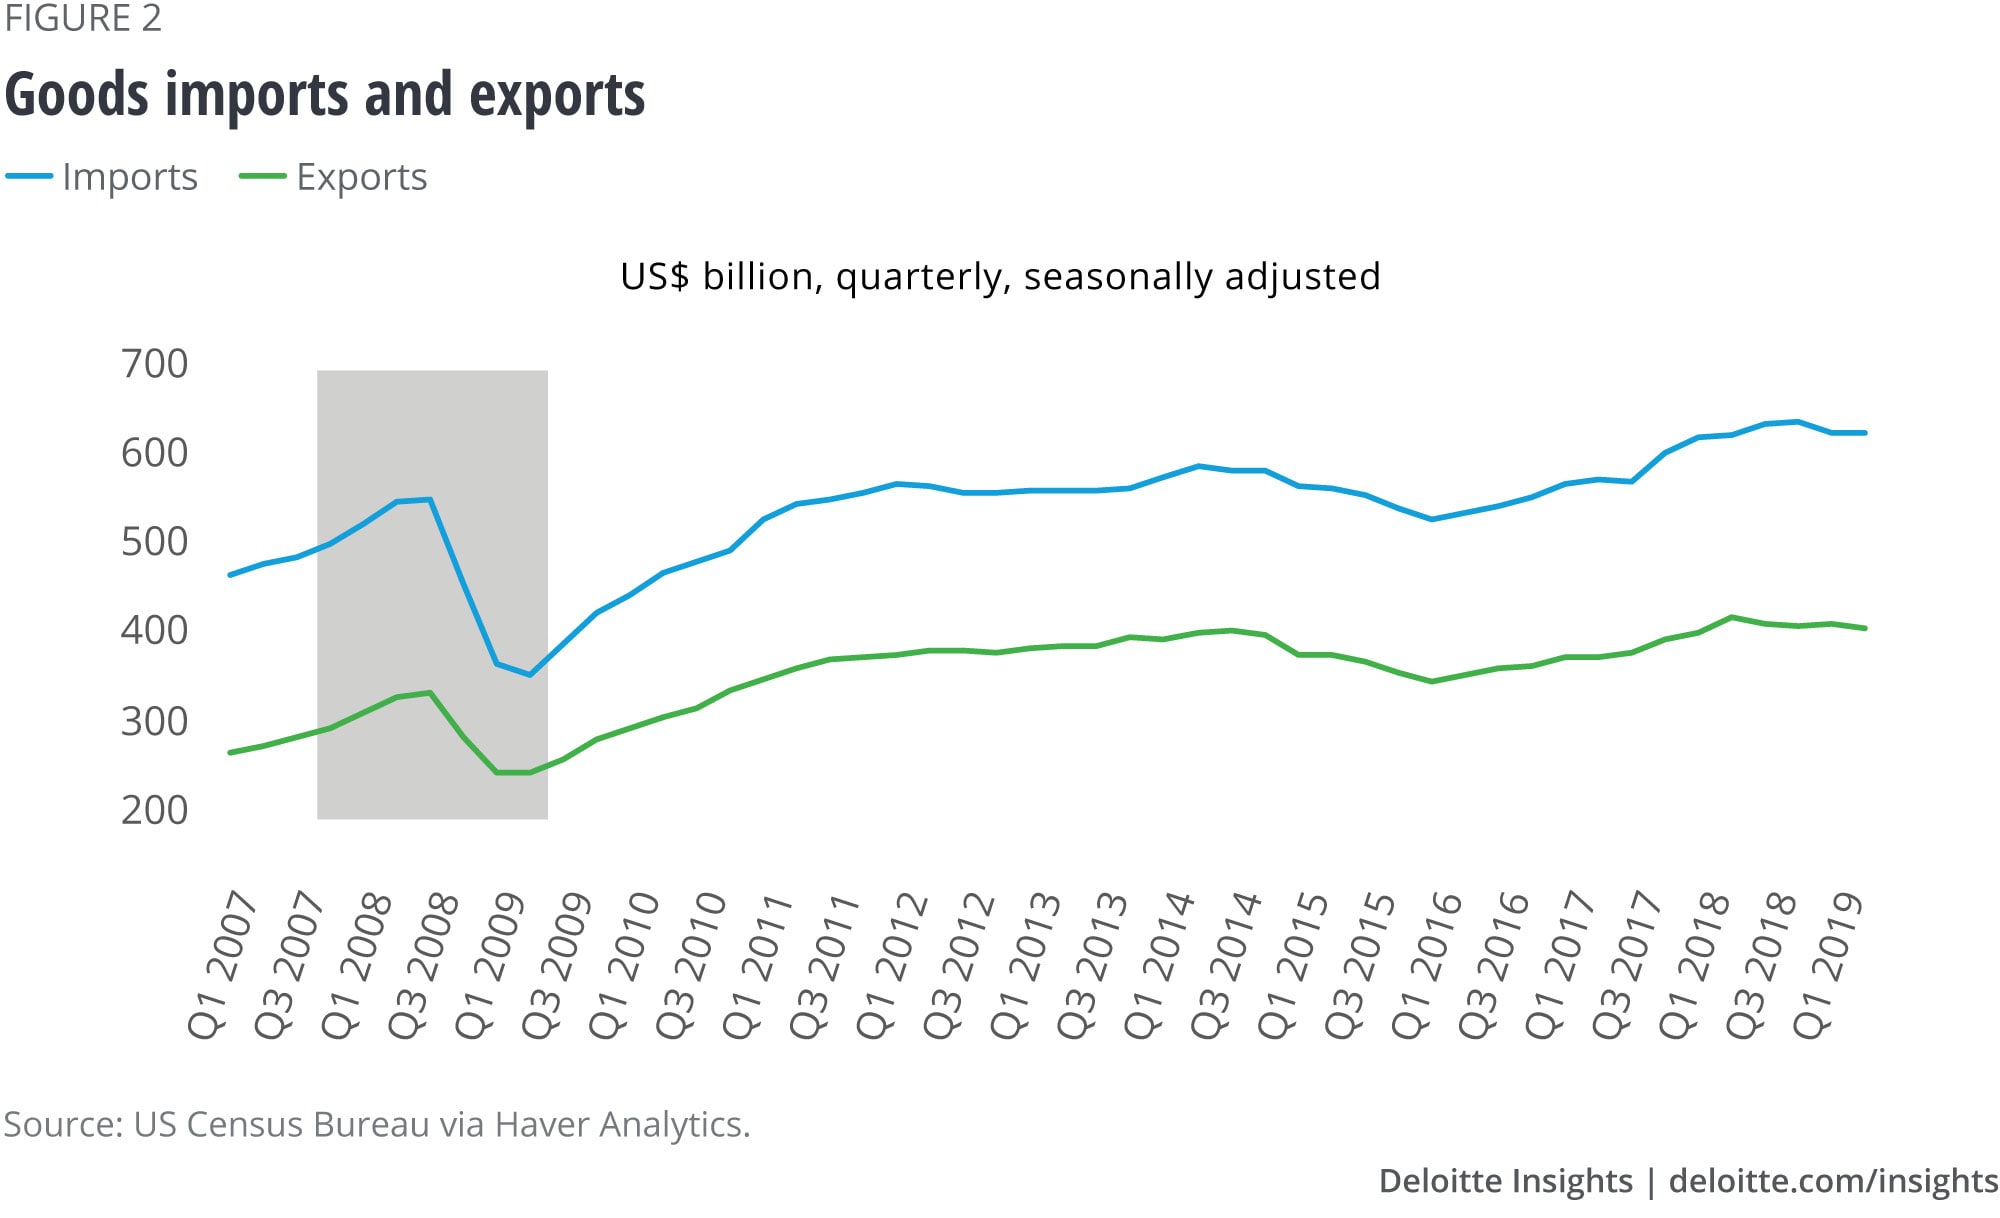
Following the end of the recession, the dollar value of goods imports and exports again resumed their upward trajectory, with the increases in the much larger import amount outweighing increases in exports, causing the trade deficit to begin growing again. However, between the beginning of 2011 and the end of 2016, growth in imports and exports first slowed and then turned negative, with the net result being a stabilization of the deficit level over the period. Post-2016, this pattern shifted, and imports and exports began growing, as did the deficit. Most recently, starting in the latter half of 2018, imports and exports again reversed course and began declining, but this time, the deficit trended higher. At present, the dollar value of the goods trade deficit is the largest it has ever been. The remainder of this piece will examine recent shifts in trade with our trading partners, which have resulted in this situation.
Looking at our top trading partners
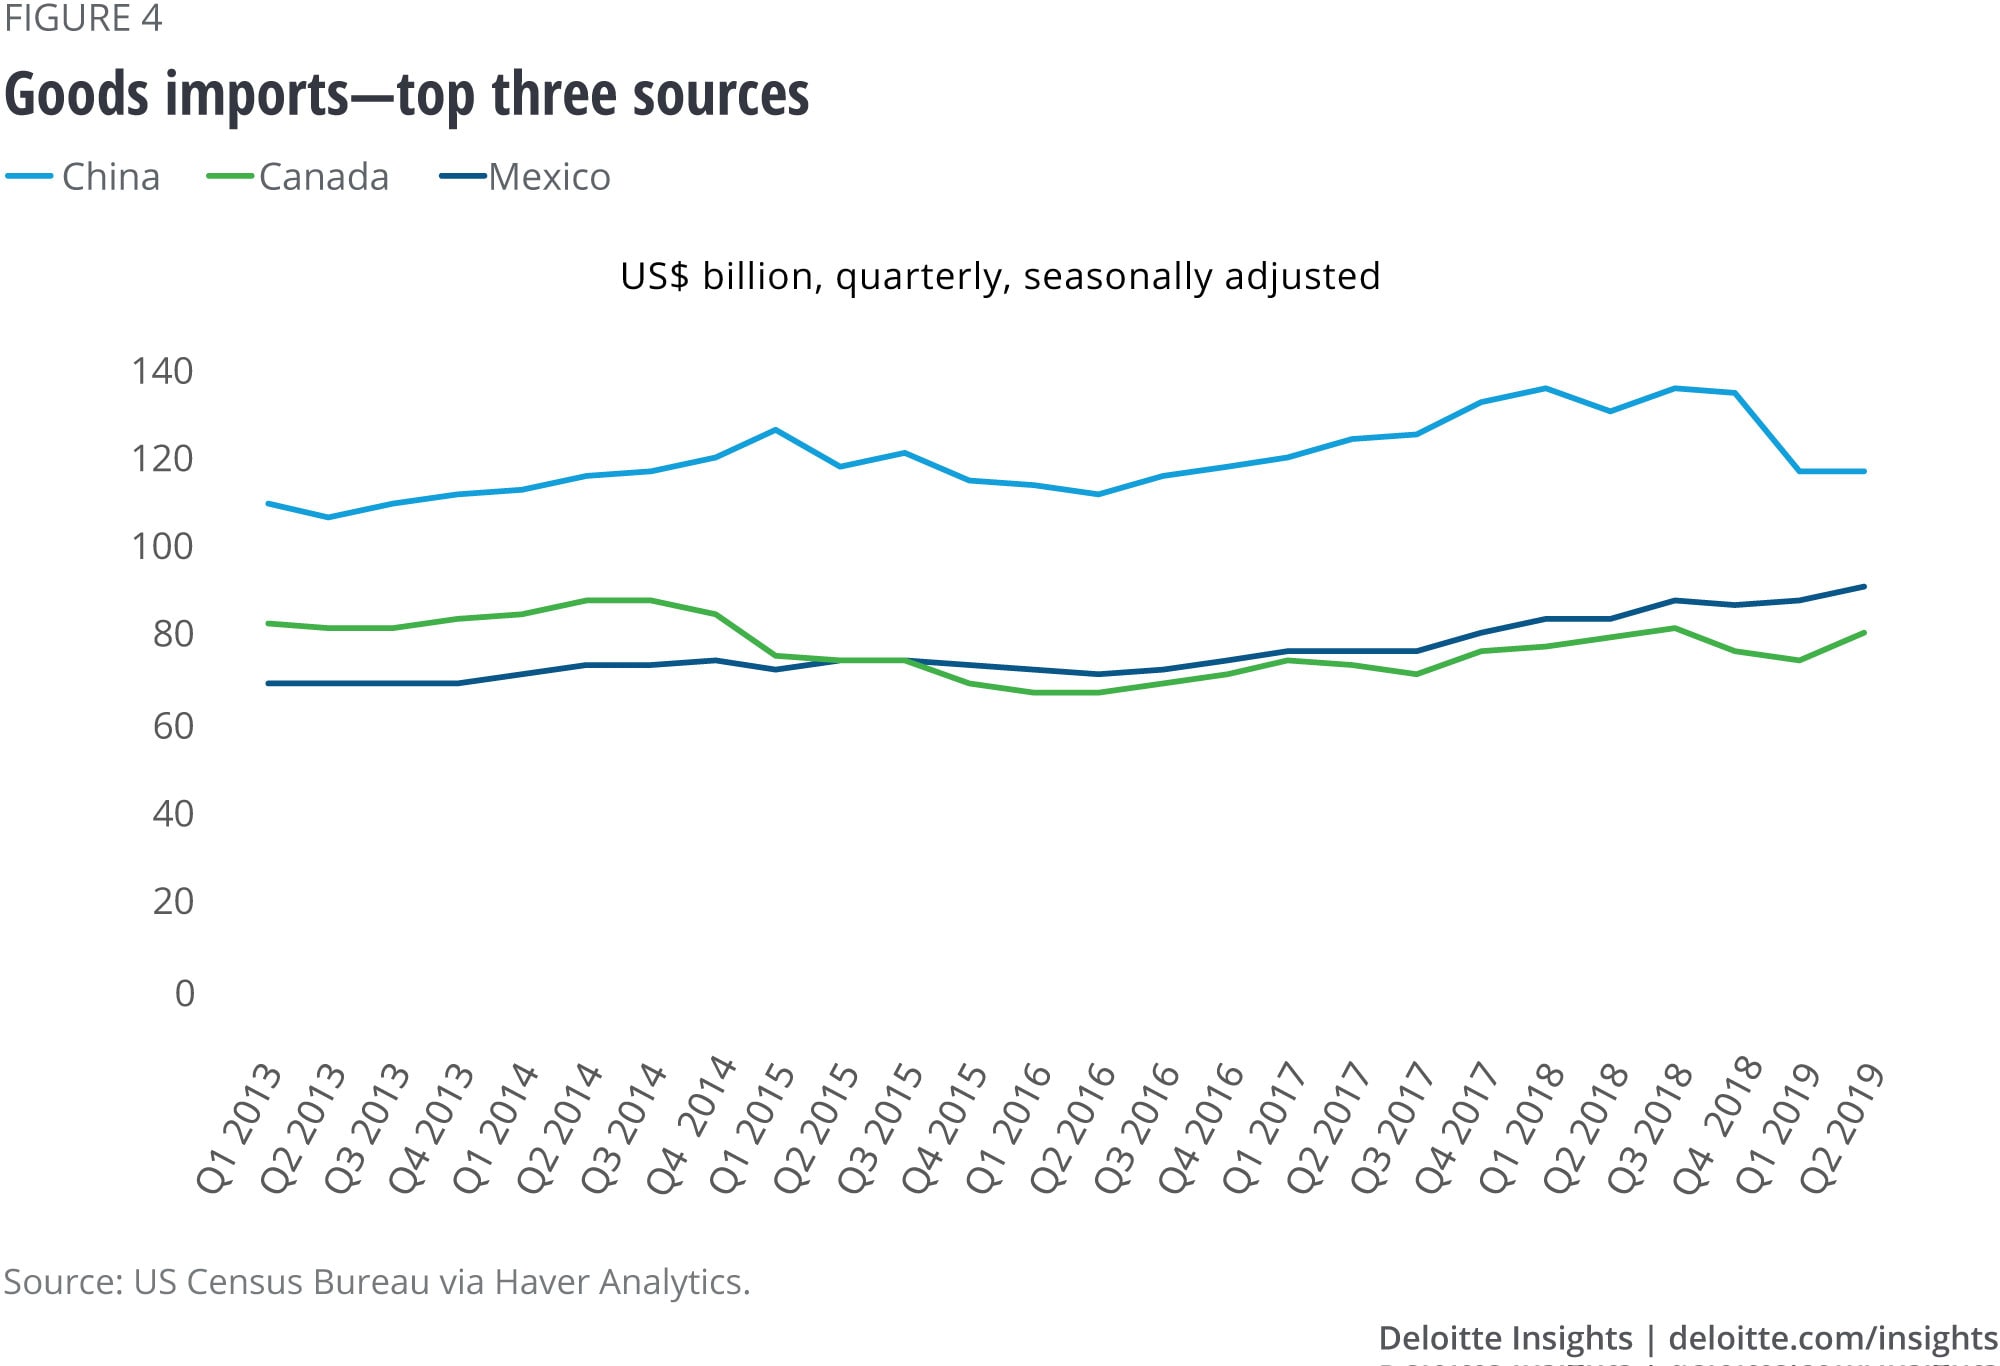
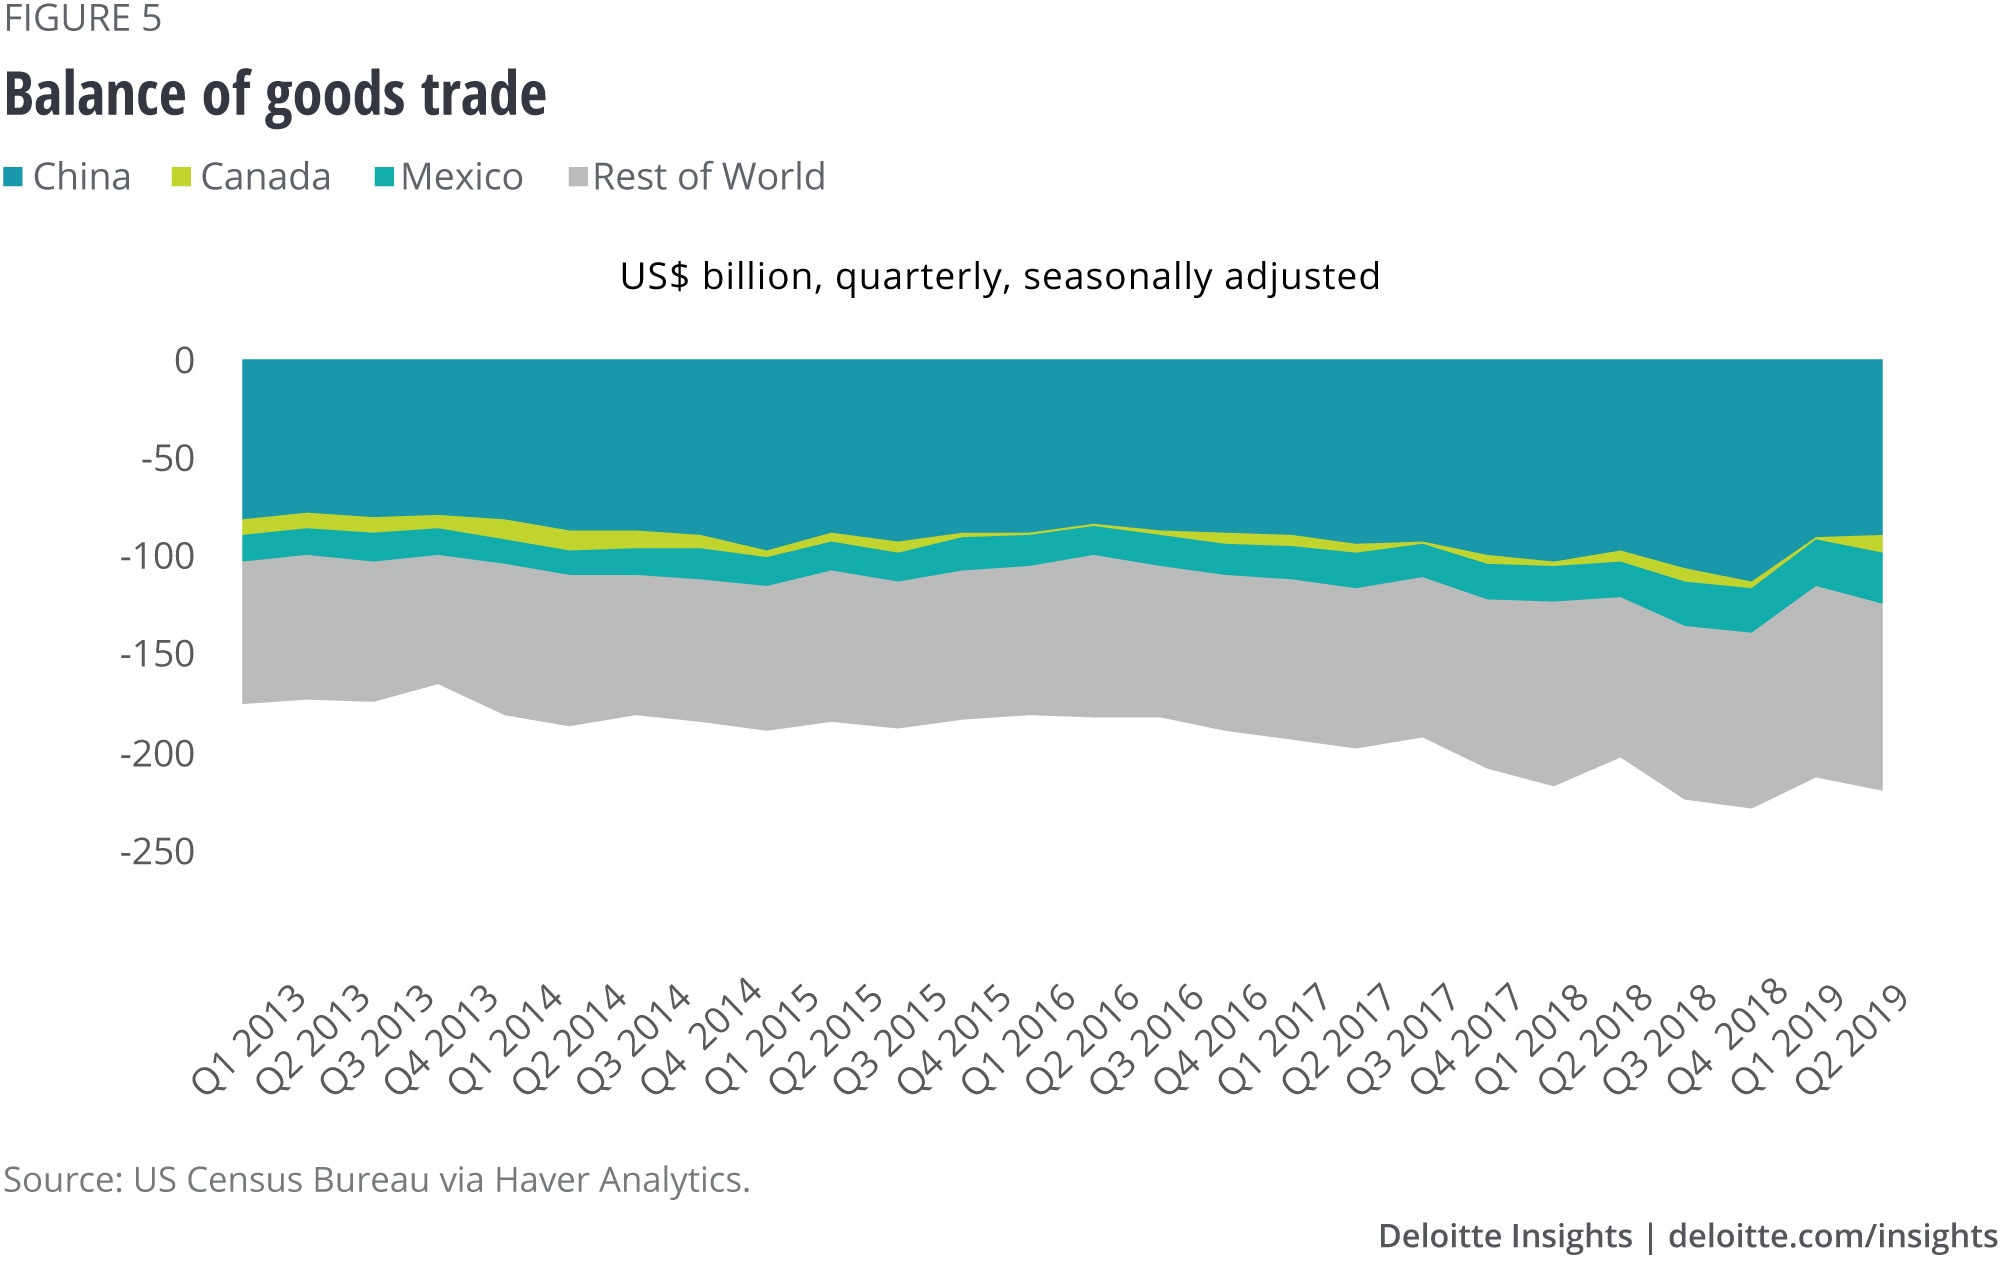
The bulk of US trade is accounted for by a relatively small number of countries. In terms of total trade (imports plus exports), our top 10 trading partners currently account for 66.0 percent of goods trade, with the top three—China, Canada, and Mexico—accounting for 42.0 percent of the total.4 These three countries are not only the top trading partners of the United States, they are also the United States’ top export markets and imports sources, albeit in differing order. Most strikingly, China is the United States’ third-largest goods export market, but is by far the largest source for US goods imports. This combination has resulted in a bilateral US-China trade deficit of US$90 billion in the most recent quarter, an amount equal to 41.0 percent of the total goods deficit for the same period. The United States also has a substantial trade deficit with Mexico (US$26 billion in Q2 2019), but a much lesser deficit with Canada (US$9 billion).
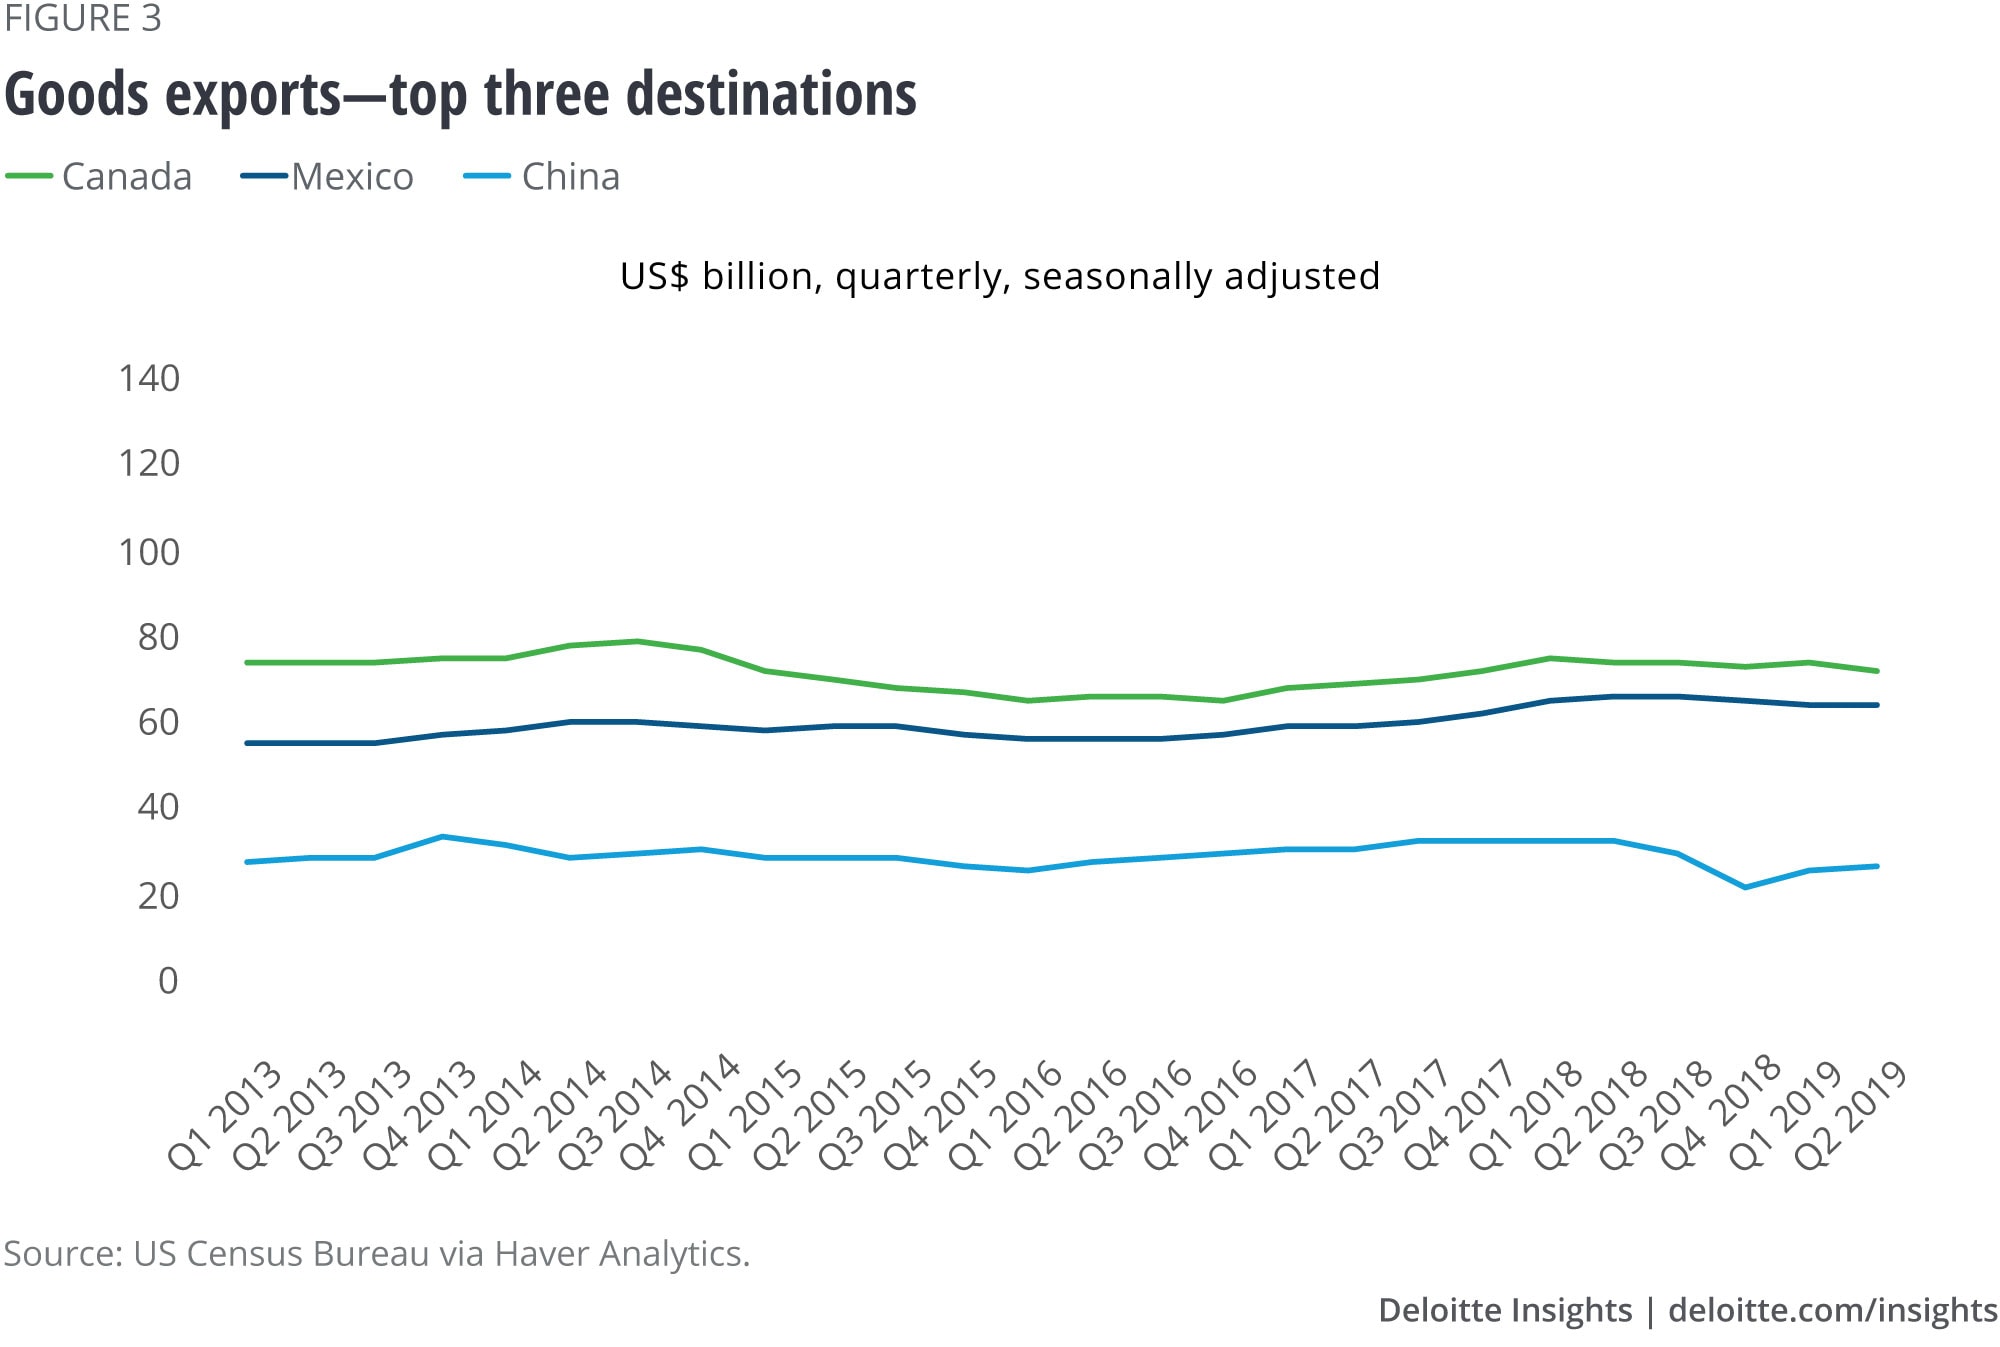
The dollar value of exports to the top three most recently peaked in Q2 2018 and, in the year since, has dropped by 5.4 percent—the same percentage as the decline in total US goods exports. The biggest drop during the period was in exports to China, which dropped by 17.4 percent. The Q2 2019 level of exports to China was a recovery of sorts—exports to China had fallen to a quarterly low in Q4 2018 to a level not seen since 2010. Between Q2 2018 and Q2 2019, Canadian exports fell by 3.0 percent, while Mexican exports fell by 2.2 percent. The large percentage drop in exports to China caused the China share of US exports to fall from 7.9 percent to 6.7 percent in just a year, while the export shares of Canada and Mexico remained very near their Q2 2018 proportions, ending at 17.7 percent and 15.8 percent, respectively.
The dollar value of imports from the top three country sources peaked a quarter later than exports (Q3 2018 rather than Q2) and, in the intervening three quarters, has fallen by 5.6 percent, again the same percentage as the decline in overall US goods imports. However, in the case of imports, the decline is very much concentrated in imports from China, which fell by 14.1 percent with almost the entire decline falling between Q4 2018 and Q1 2019. Imports from Mexico rose 2.6 percent between the Q3 2018 peak and Q2 2019, as imports from Canada dipped before returning to their Q3 2018 level. With total imports falling and imports from Mexico increasing during these three quarters, Mexico increased its import share from 13.9 percent to 14.4 percent. The Canadian import share also rose slightly to 12.9 percent. The share of US imports coming from China fell to 18.6 percent in Q2 2019 from 21.3 percent in Q3 2018.
The net result of the export and import trends of the top three trading partners over the last couple of quarters has been a substantial reduction of 20.5 percent in the bilateral goods deficit with China, an increase of 19.4 percent in the deficit with Mexico, and no clear trend emerging in the deficit with Canada (see figure 5). The US$23 billion reduction in the quarterly dollar value of the deficit with China between Q4 2018 and Q2 2019 is much larger than the decline in the total goods deficit of US$9 billion over the same period. Much of this increase in the “Rest of the World” deficit (see figure 5) was the result of increases in the bilateral goods deficits with Japan, France, and Taiwan and the flip in the US-UK trade relationship from surplus to deficit.
It is not by happenstance that the focus of recent activity in trade has been on Canada, Mexico, and China. As the largest trading partners of the United States, it is natural that attention would fall first on these countries. However, given that the replacement for the North American Free Trade Agreement (NAFTA), the USMCA (US/Mexico/Canada Agreement), is awaiting ratification in the US Congress and the size of the Mexican and Canadian goods deficit is relatively small, the trade situation between the United States and its northern and southern neighbors appears to have quieted. Unfortunately, the same cannot be said for the US-China trading relationship—with new tariffs coming into effect in September and the possibility of additional tariffs being added in October and December, the situation appears to be deteriorating.
Product shifts in China trade
Tariffs and retaliatory actions have not only reduced the total amount of trade between the United States and China, they have also skewed the volumes of specific products being traded. However, at this point, the relative role of tariffs—compared to other factors, such as slowing growth in China—is unclear. As mentioned earlier, China is the third-largest goods export market for the United States—and this remains true even as exports have fallen over the first half of this year. Among the top exports to China in 2018 were aircraft and motor vehicles, but in the first six months of 2019, exports of aircraft and motor vehicles fell 19.6 percent and 25.2 percent, respectively.5 The export of electronic integrated circuits, another key US export to China, moved in the opposite direction, increasing 53.7 percent in the first half of 2019, perhaps due to China’s earlier commitment to buy more US-made microchips.6
Direct repercussions of the trade conflict are being felt perhaps most by American farmers, due to retaliatory tariffs imposed by China. US agricultural exports command significant market share in China, which was the fourth-largest agricultural export market for the United States in 2018. Soybeans and cotton from the United States, which top the list of agricultural exports to China, both accounted for roughly 40 percent of China’s total import of each commodity in 2016.7 Exports of both products were impacted in 2018 and early 2019. Soybean exports to China plummeted 74.5 percent in 2018, and have remained flat relative to the same period a year ago, according to data for the first six months of 2019. Soybean exports to China account for 10.0 percent of total soybean production in the United States.8 Soybean farmers in Illinois and Iowa are likely to be affected by the fall in exports as the two states jointly account for a little less than a third of the country’s soybean output.9 Cotton exports fell 9.5 percent in 2018 and 36.0 percent from a year ago in the first half of 2019. Hides, skins, and leather exports to China fell 37.7 percent in the first half of 2019; pork exports fell 16.7 percent in 2018 but recovered some lost ground in the first half of 2019 (increasing 18.0 percent from the same period in 2018); corn exports tumbled 61.0 percent in 2018 and a further 38.4 percent from a year ago in the first half of 2019.10 Other countries have rushed to fill the gap between Chinese demand and US supply of agricultural produce—Brazil, for instance, has increased exports of soybeans to China, while both Australia and Brazil have increased their cotton exports to China.
On the import front, US imports from China (US$ 219 billion) decreased 12.4 percent in the first six months of 2019 relative to the same period a year ago.11 Iron and steel imports from China fell 4.4 percent and aluminum imports decreased 21.6 percent during the same period.12
As we reported in an earlier piece, Balancing payments: Why it’s harder than you might think to cut the trade deficit, it is unlikely that taxing imports (i.e., instituting tariffs), will reduce the trade deficit. Rather, a reduction in trade levels is likely as both imports and exports fall (as we are currently experiencing). But the trade deficit supports foreigners’ demand for US dollars—dollars they get, in part, by selling their goods and services to the United States. With strong demand, the dollar exchange rate is bid up, which, in turn, makes US exports less competitive. The trade-weighted value of the dollar recently surpassed its prior peak from 2002.13 Additionally, the Chinese have allowed the renminbi to fall to its lowest level in more than 10 years. The economic forces of international finance appear to be dominating the day . . . and the trade deficit.
© 2021. See Terms of Use for more information.
More from the Economics collection
-
Balancing payments Article8 years ago
-
Trade disputes will weigh on the economy, but by how much? Article6 years ago
-
Global Weekly Economic Update Article3 days ago
-
All in a day’s work—and sleep and play: How Americans spend their 24 hours Article6 years ago
-
China’s economy cools as US trade tension heats up Article6 years ago
-
Issues by the Numbers, July 2018 Article6 years ago


