
Employment growth set to shift to a slower lane Economics Spotlight, December 2019
7 minute read
17 December 2019
Every month, observers of the US economy eagerly await the “first Friday” release of the employment numbers. But given the changes in labor force participation and demographics, how should these numbers be interpreted going forward?
In September 2019, the unemployment rate in the United States fell to 3.5 percent, the lowest in a little more than 50 years.1 This rate is a far cry from the steep rise witnessed after the onset of the Great Recession, a rise that culminated in an unemployment rate of 10 percent in October 2009. With the devastation of the last recession now more than 10 years behind us, the current economic recovery2 has trimmed the unemployment rolls to levels not seen since 2001. And the pace of employment generation—a little more than 2 million on average per year between 2010 and 20193—has been fast enough to accommodate new entrants to the labor force as well.
Learn more
Explore the Economics Spotlight collection
Subscribe to receive related content
Download the Deloitte Insights and Dow Jones app
However, expectations that this trend of strong employment growth will continue are likely misplaced, for two reasons. First, there are simply fewer unemployed persons available to add to total employment—we are now at the point where there is less than one unemployed person for every job opening.4 Second, as evident from an analysis of data on labor force participation and the net flow of people into the labor force and into employment—i.e., new entrants minus those exiting—not as many people are moving into the labor force (and further into employment) as they did in the 1990s and the early 2000s.
Employment has surged even as labor force participation has fallen
Over recent decades, employment has grown at a faster pace than the economy’s labor force. Between 1991 and 2019, a period covering three business cycles,5 employment grew at an average annual rate6 of 1 percent, higher than the corresponding 0.9 percent rise for the labor force. And this pace has diverged further over the past decade: While employment has risen on average by 2 million per year since 2010, growth in the labor force has been slower (1.1 million per year). In fact, slowing labor force growth has been coinciding with a broad decline in the labor force participation rate—defined as the share of the working age population working or looking for work—since the late 1990s (see figure 1).
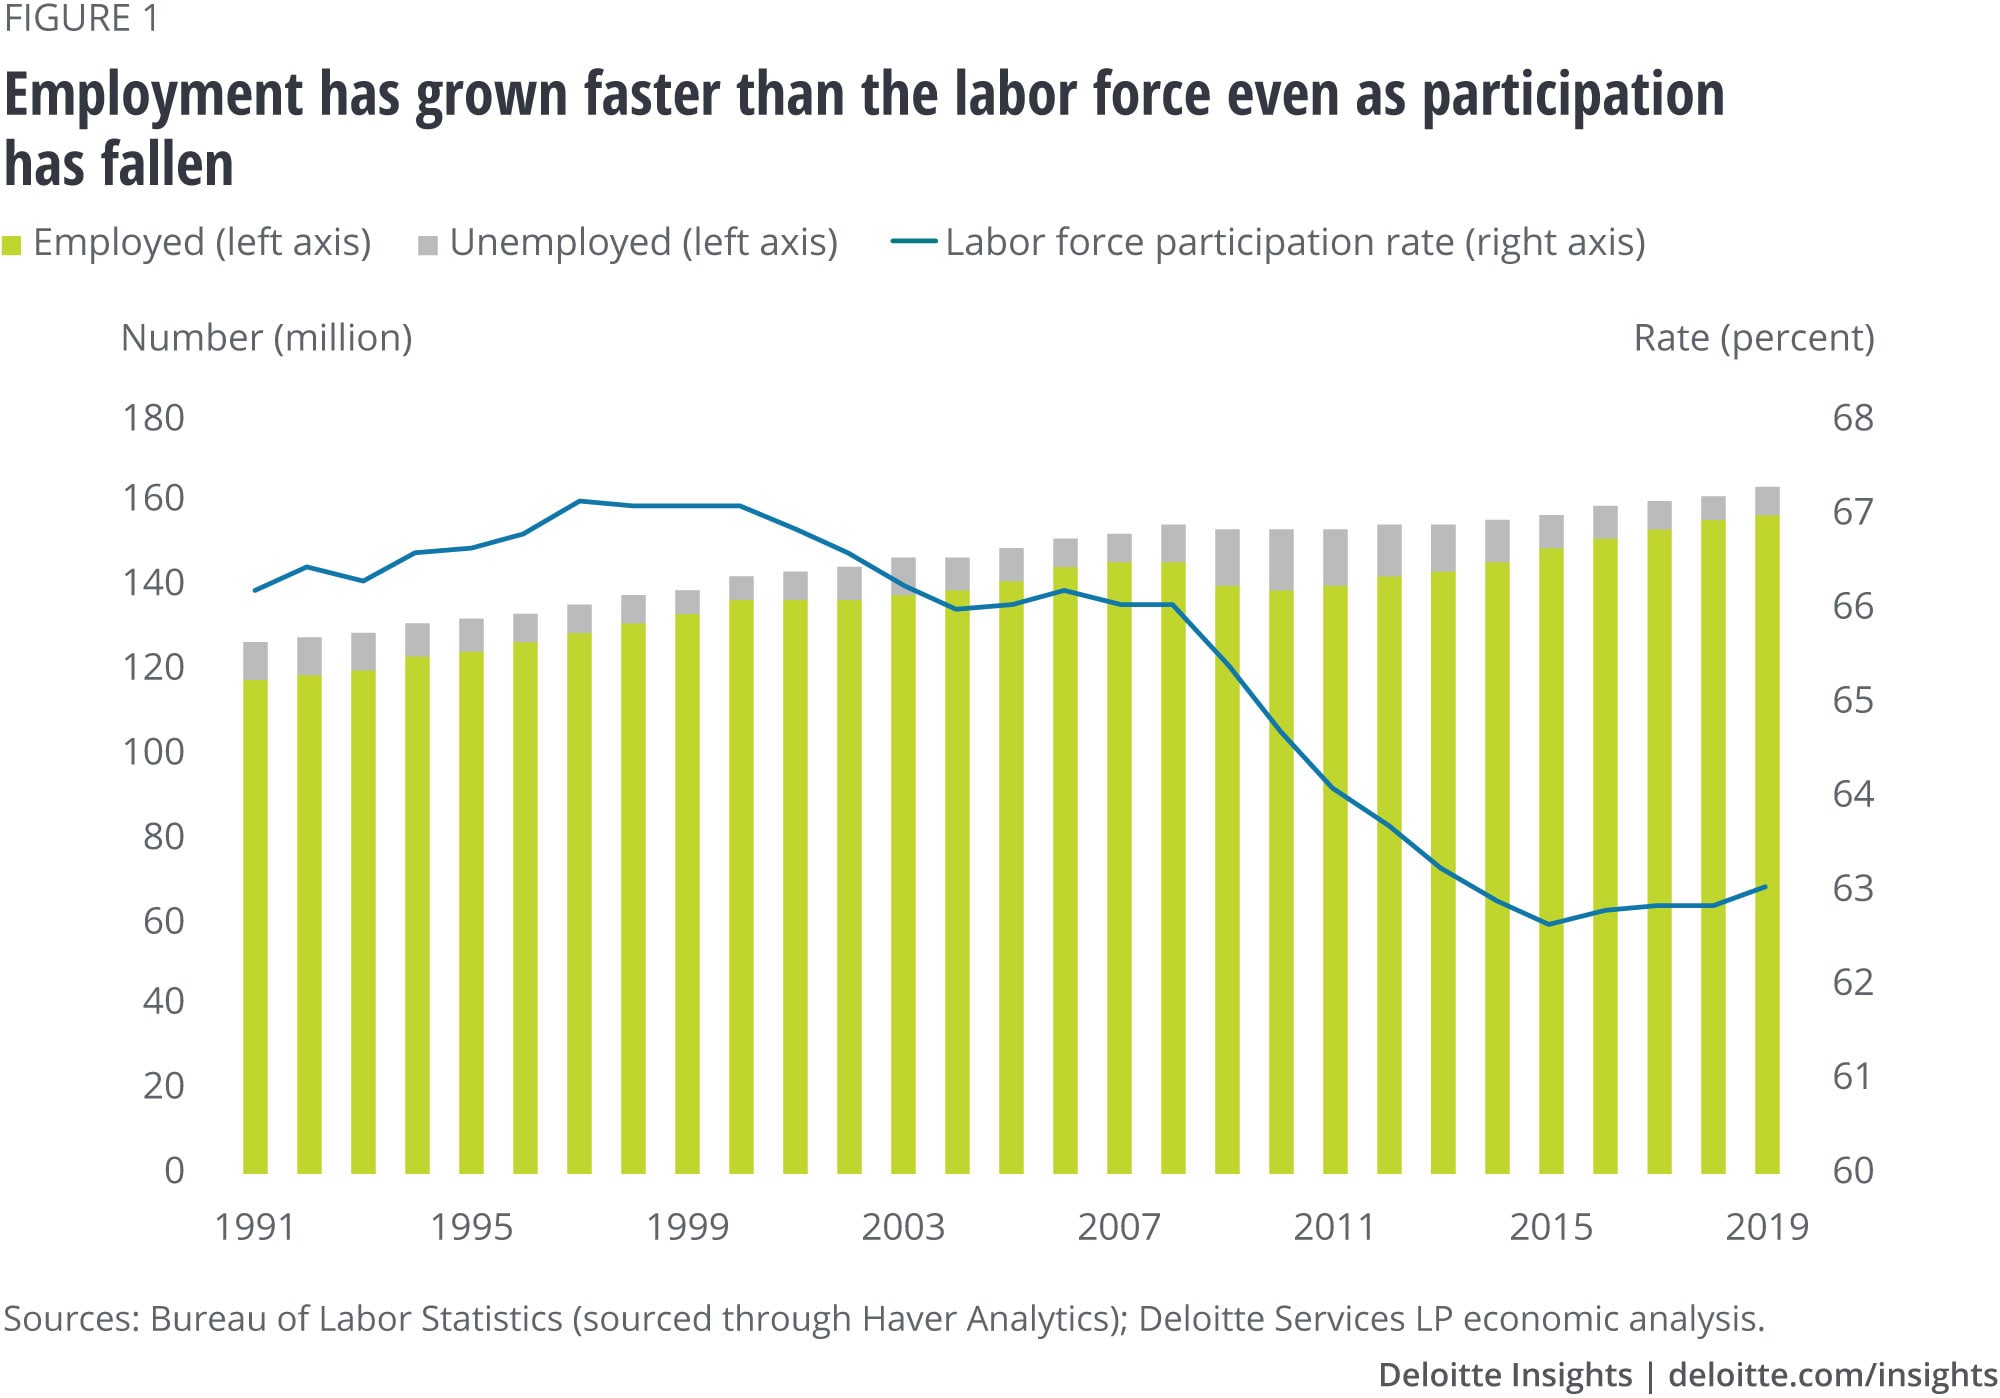
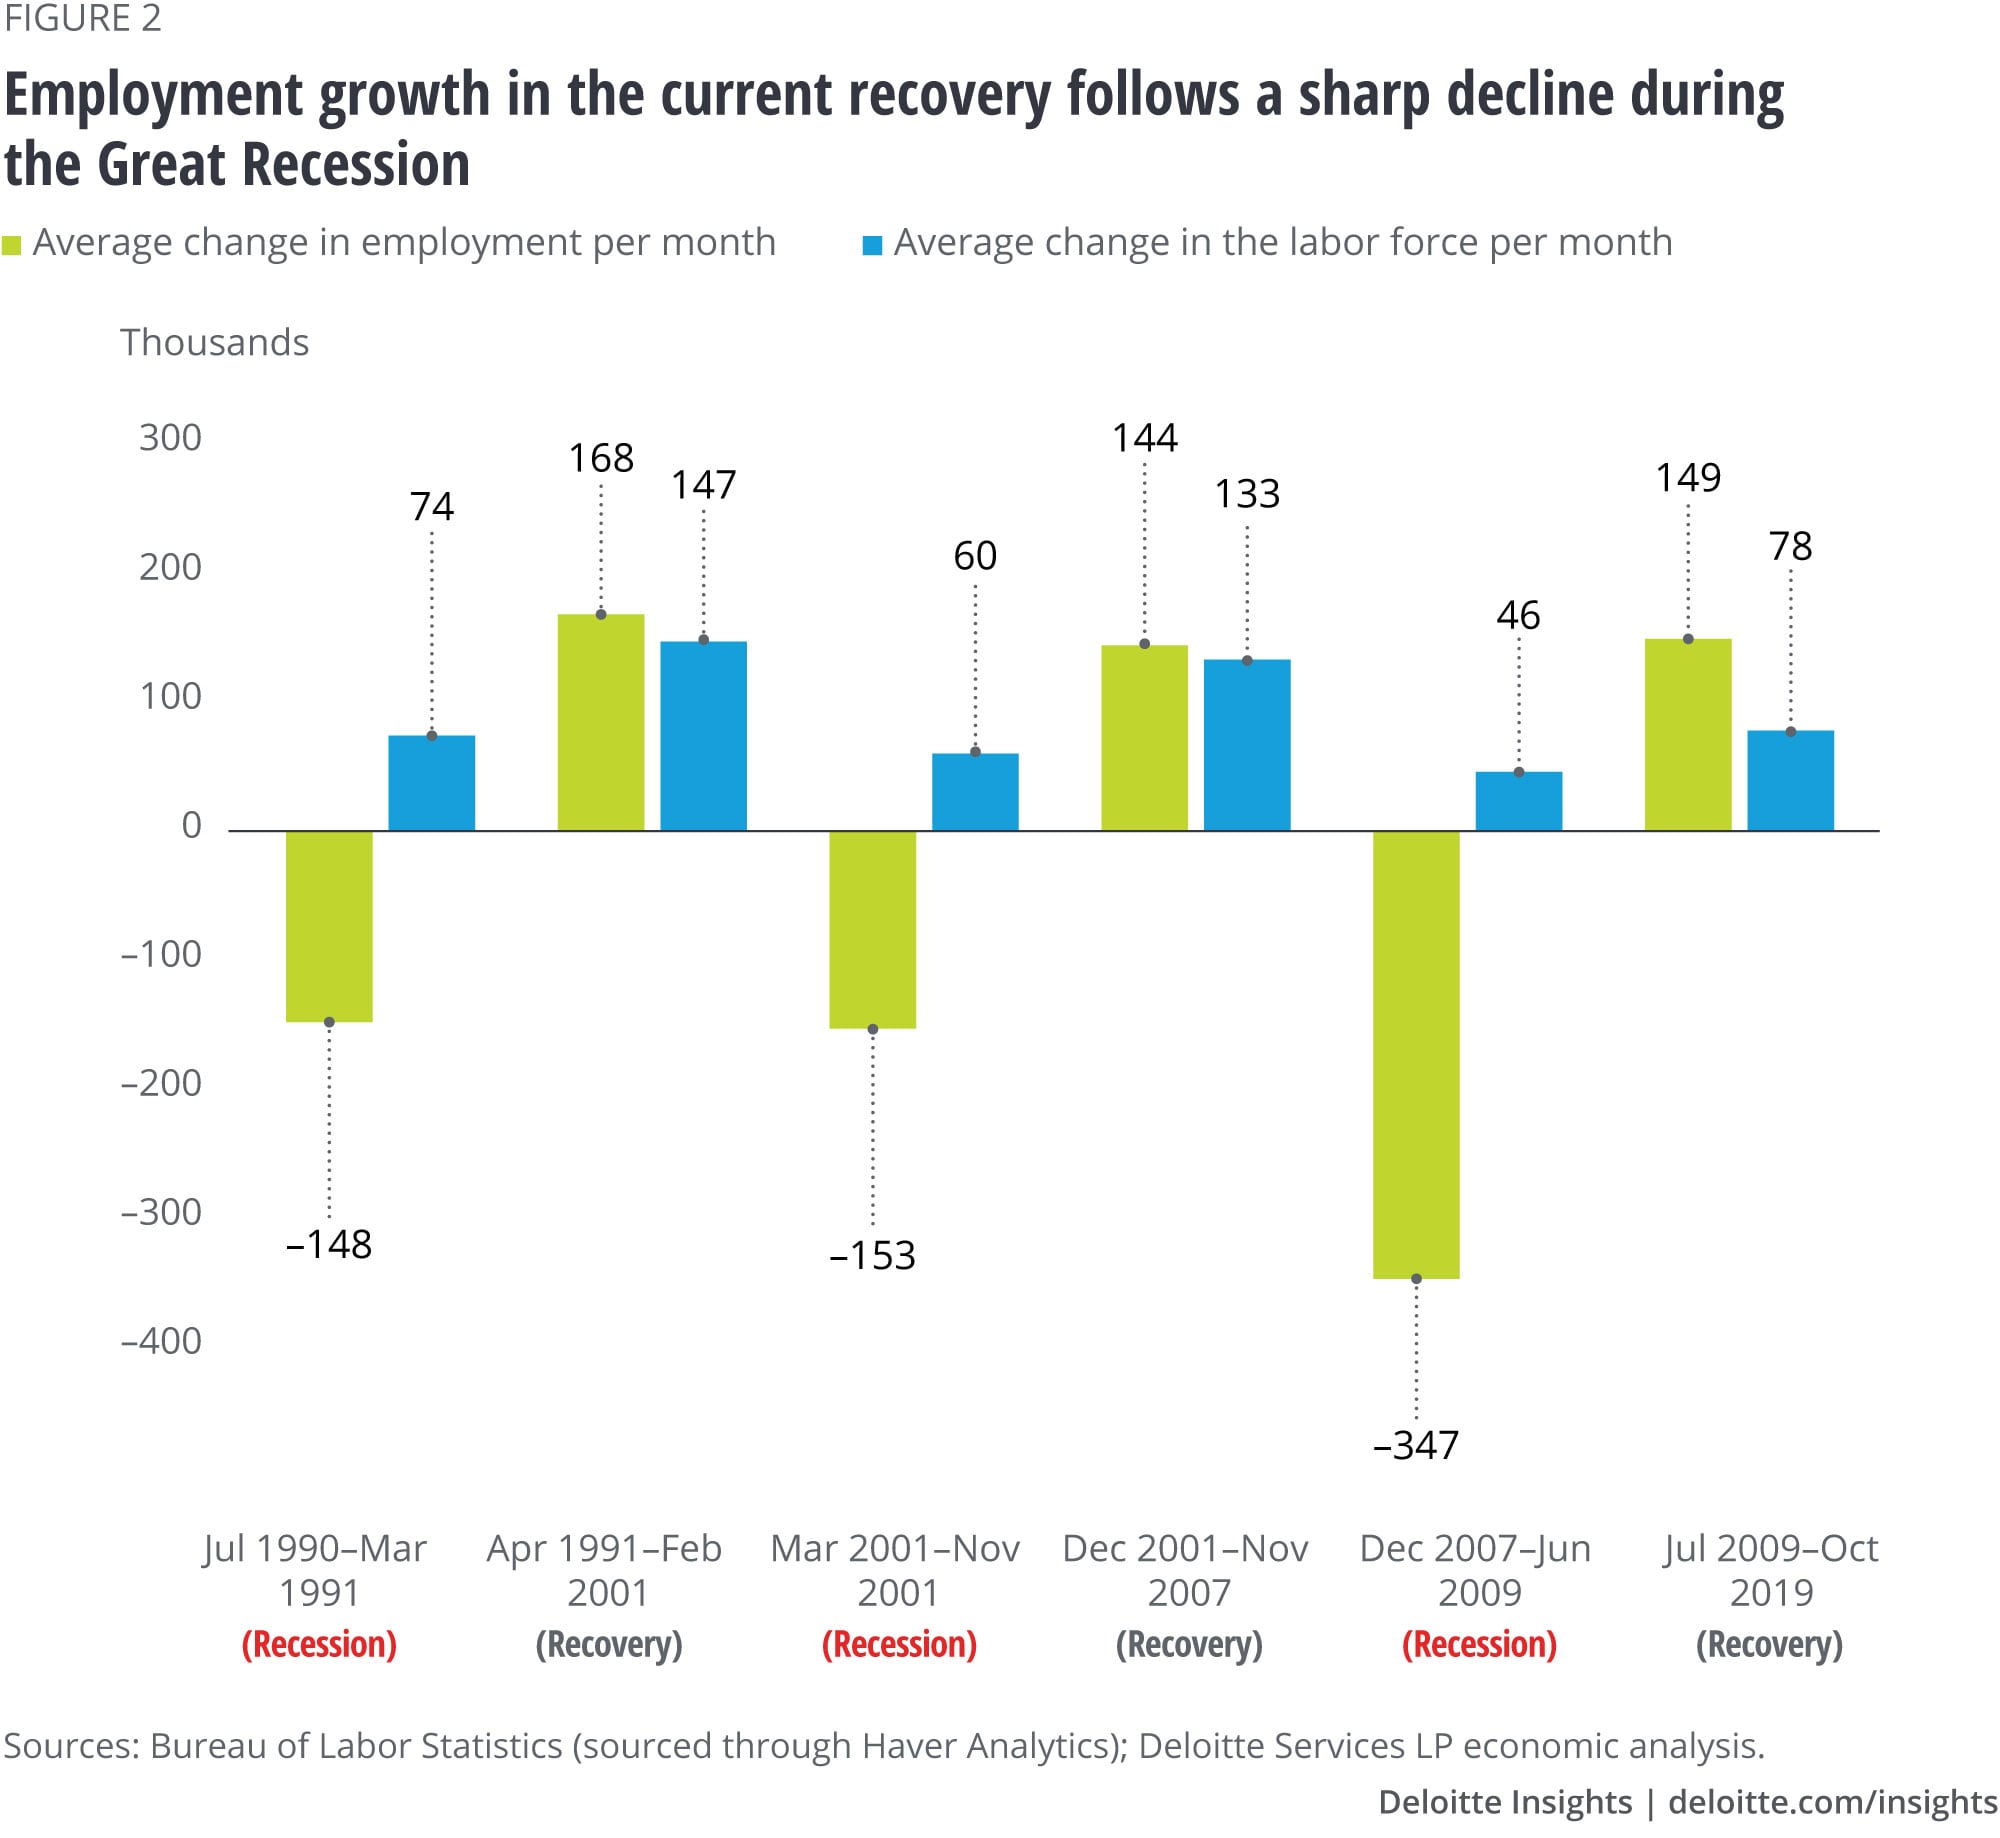
The surge in employment since 2010 comes after a severe dent to the labor market due to the downturn of 2008–2009.7 Analysis of the last three business cycles reveals that loss of employment in the last recession was much higher than in the previous two. Between December 2007 and June 2009, employment, on average, fell by 347,000 per month, more than twice the decline in the two previous recessions (see figure 2). So, as the recovery took shape from July 2009, there was a much larger gap in the labor market left to fill than in the two previous recoveries. Figure 2 also reveals that since December 2007, labor force growth has been slower than in previous business cycles. With unemployment now at record lows and labor force growth slowing, the likelihood of employment continuing to grow at the same pace as in this recovery (149,000 per month on average) is low.
It’s the unemployed rather than new entrants who have been bolstering employment growth
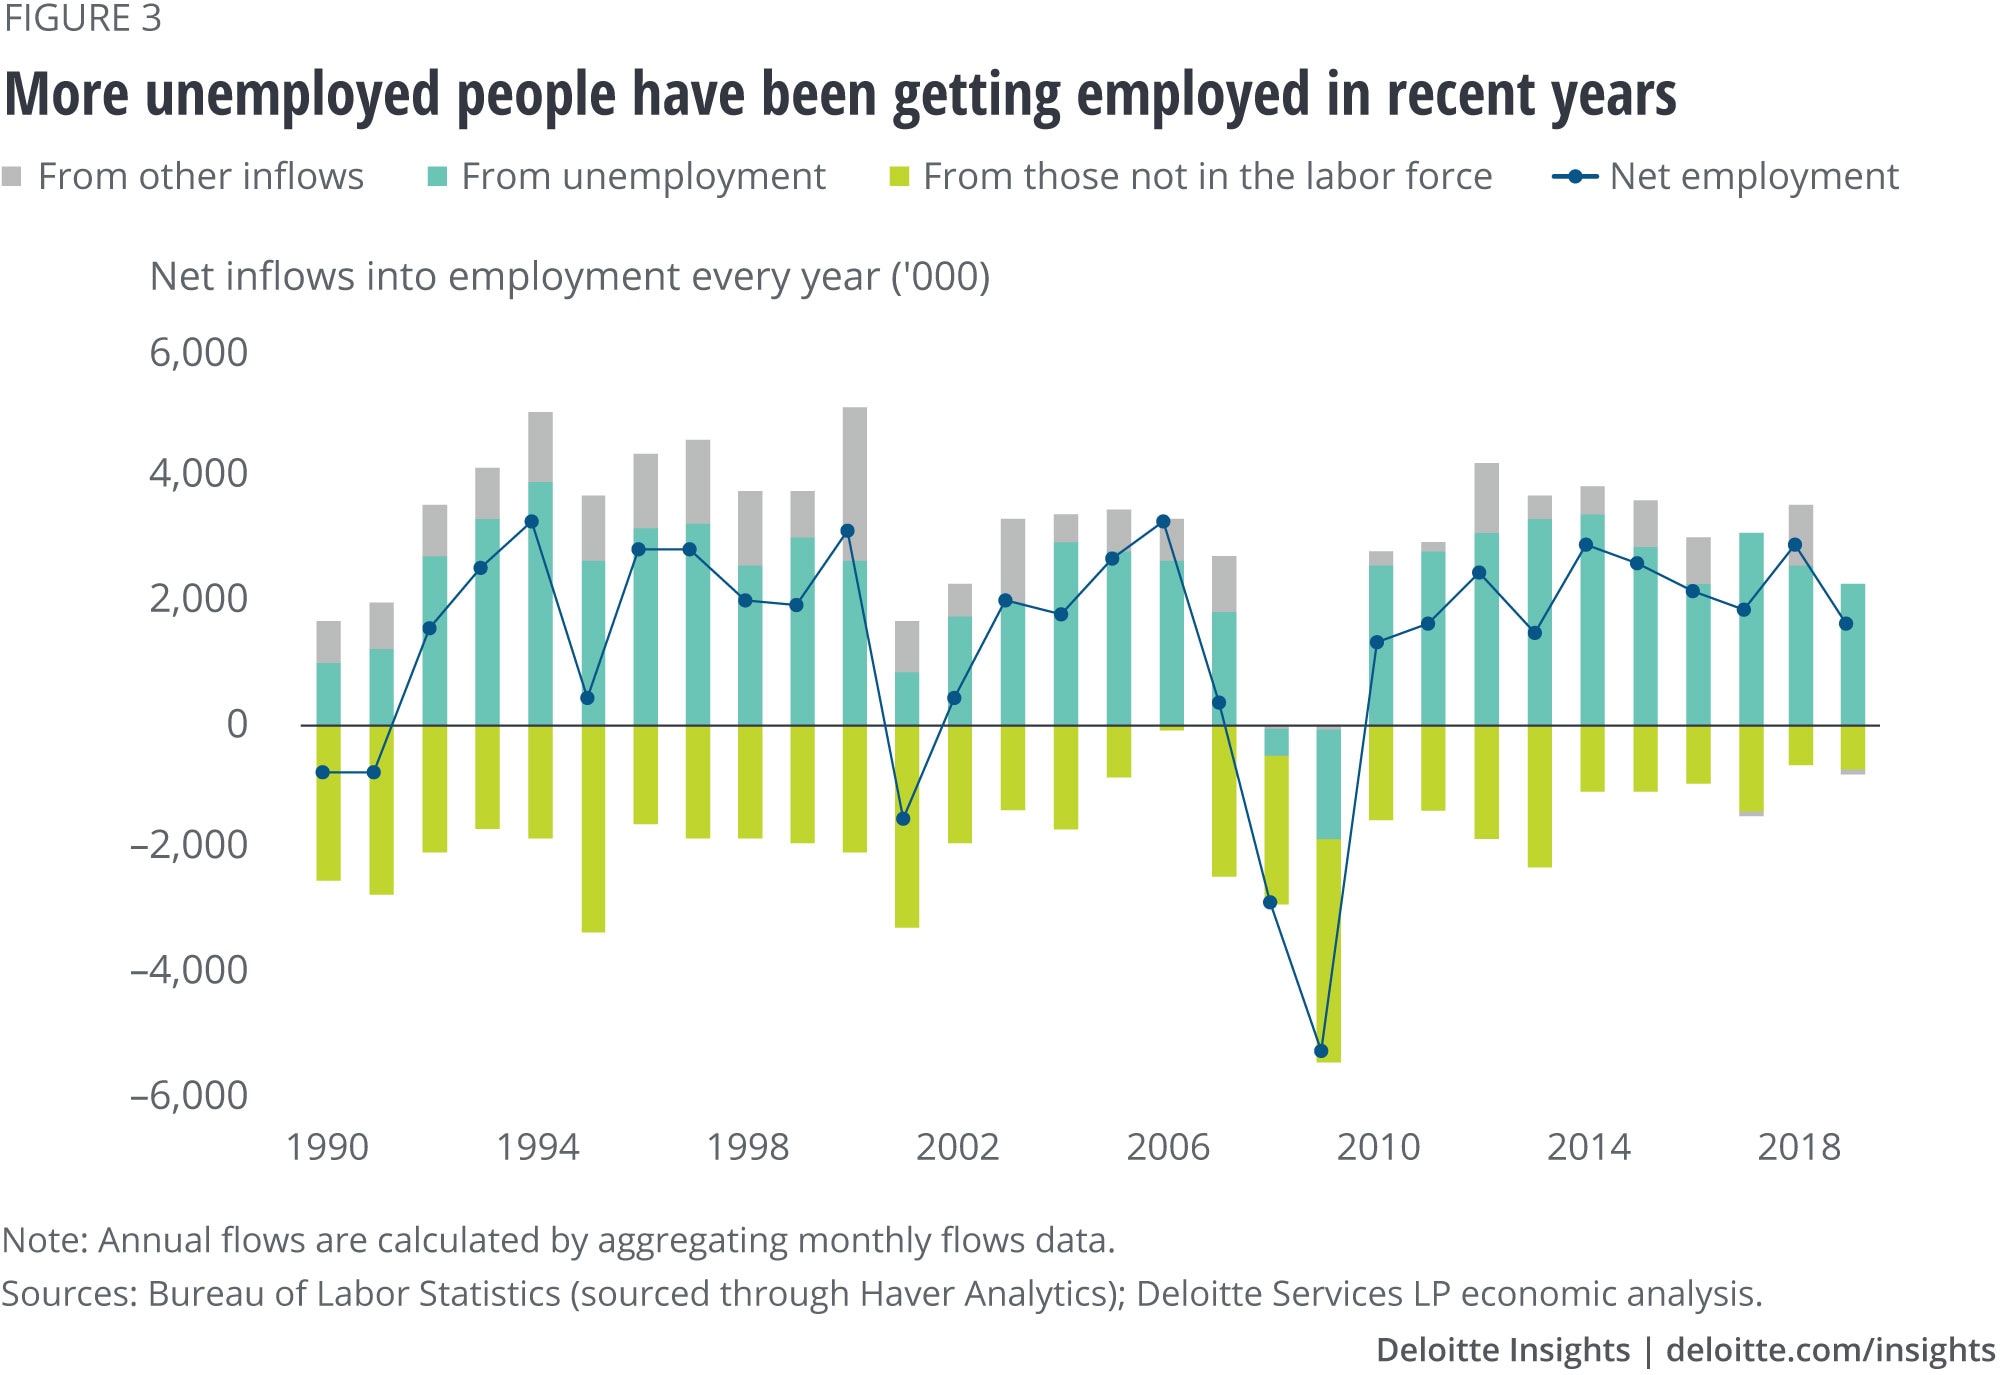
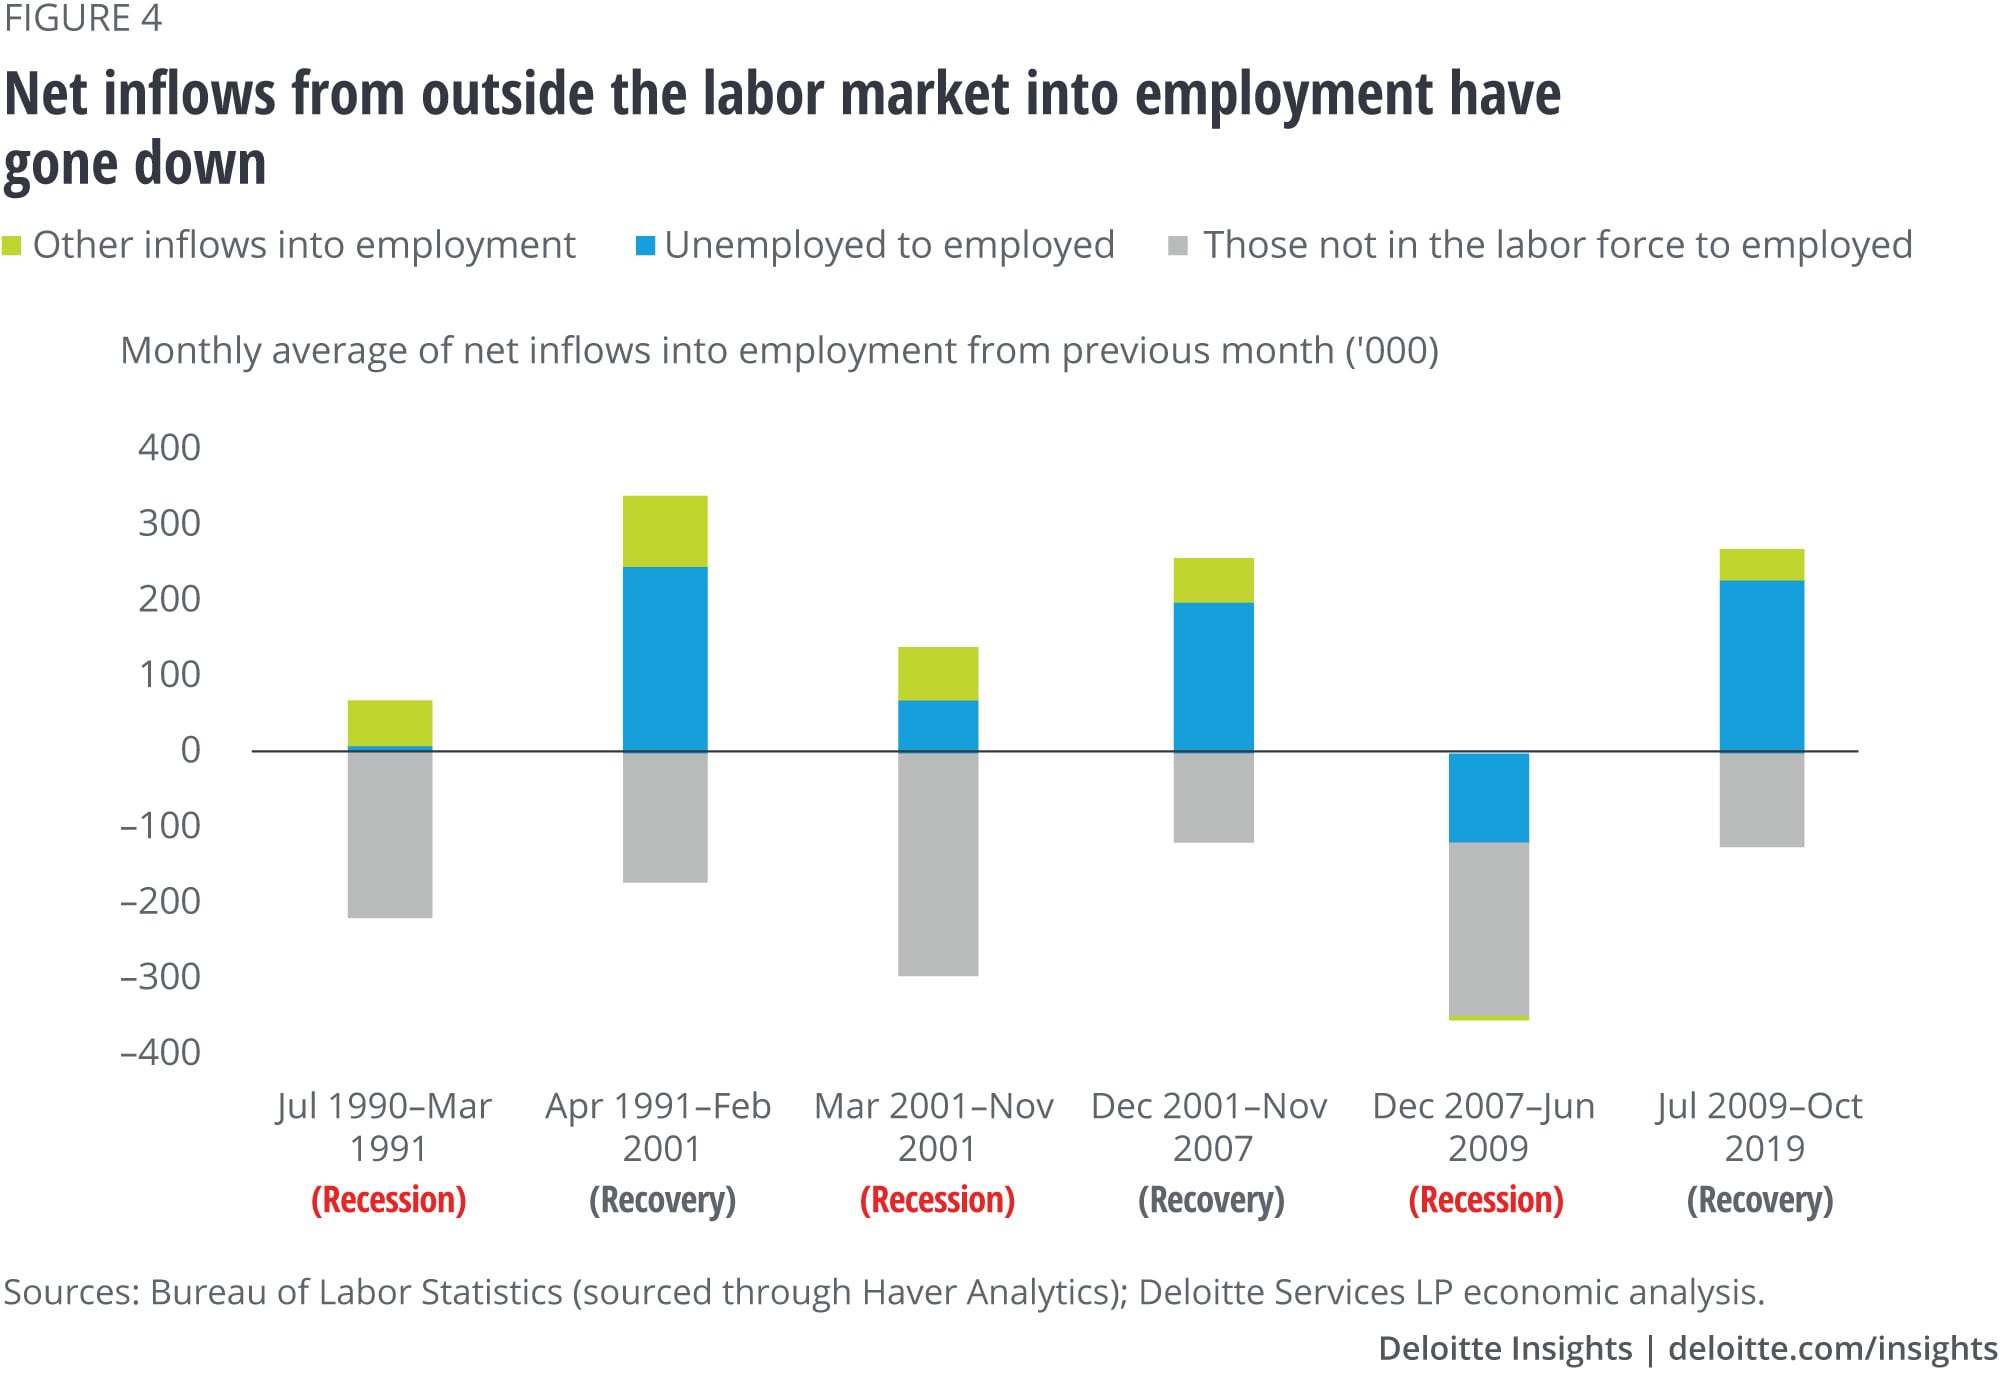
Analysis of the labor flow status data from the Bureau of Labor Statistics’ (BLS’) Current Population Survey reveals that net inflows into employment from those who are unemployed form a major share in overall employment gains (see figure 3).8 And this component has impacted employment more during this recovery than in the previous one.9 Between July 2009 and October 2019, net inflows from unemployed to employed, on average, was 230,000 per month, higher than 197,000 in the previous recovery and only slightly lower than the figure for April 1991–February 2001 (see figure 4).
Figures 3 and 4 also show that the impact of net inflows from outside the labor market—those re-entering the labor force and those entering for the first time—on employment is relatively low in recent years compared to the 1990s and the early 2000s. This is likely due to two reasons. First, there is less inflow of first-time entrants into the labor force compared to a decade or two back. Second, relatively more people are moving out of the labor force and out of employment (many of them into retirement).
The labor force isn’t growing as fast as it used to
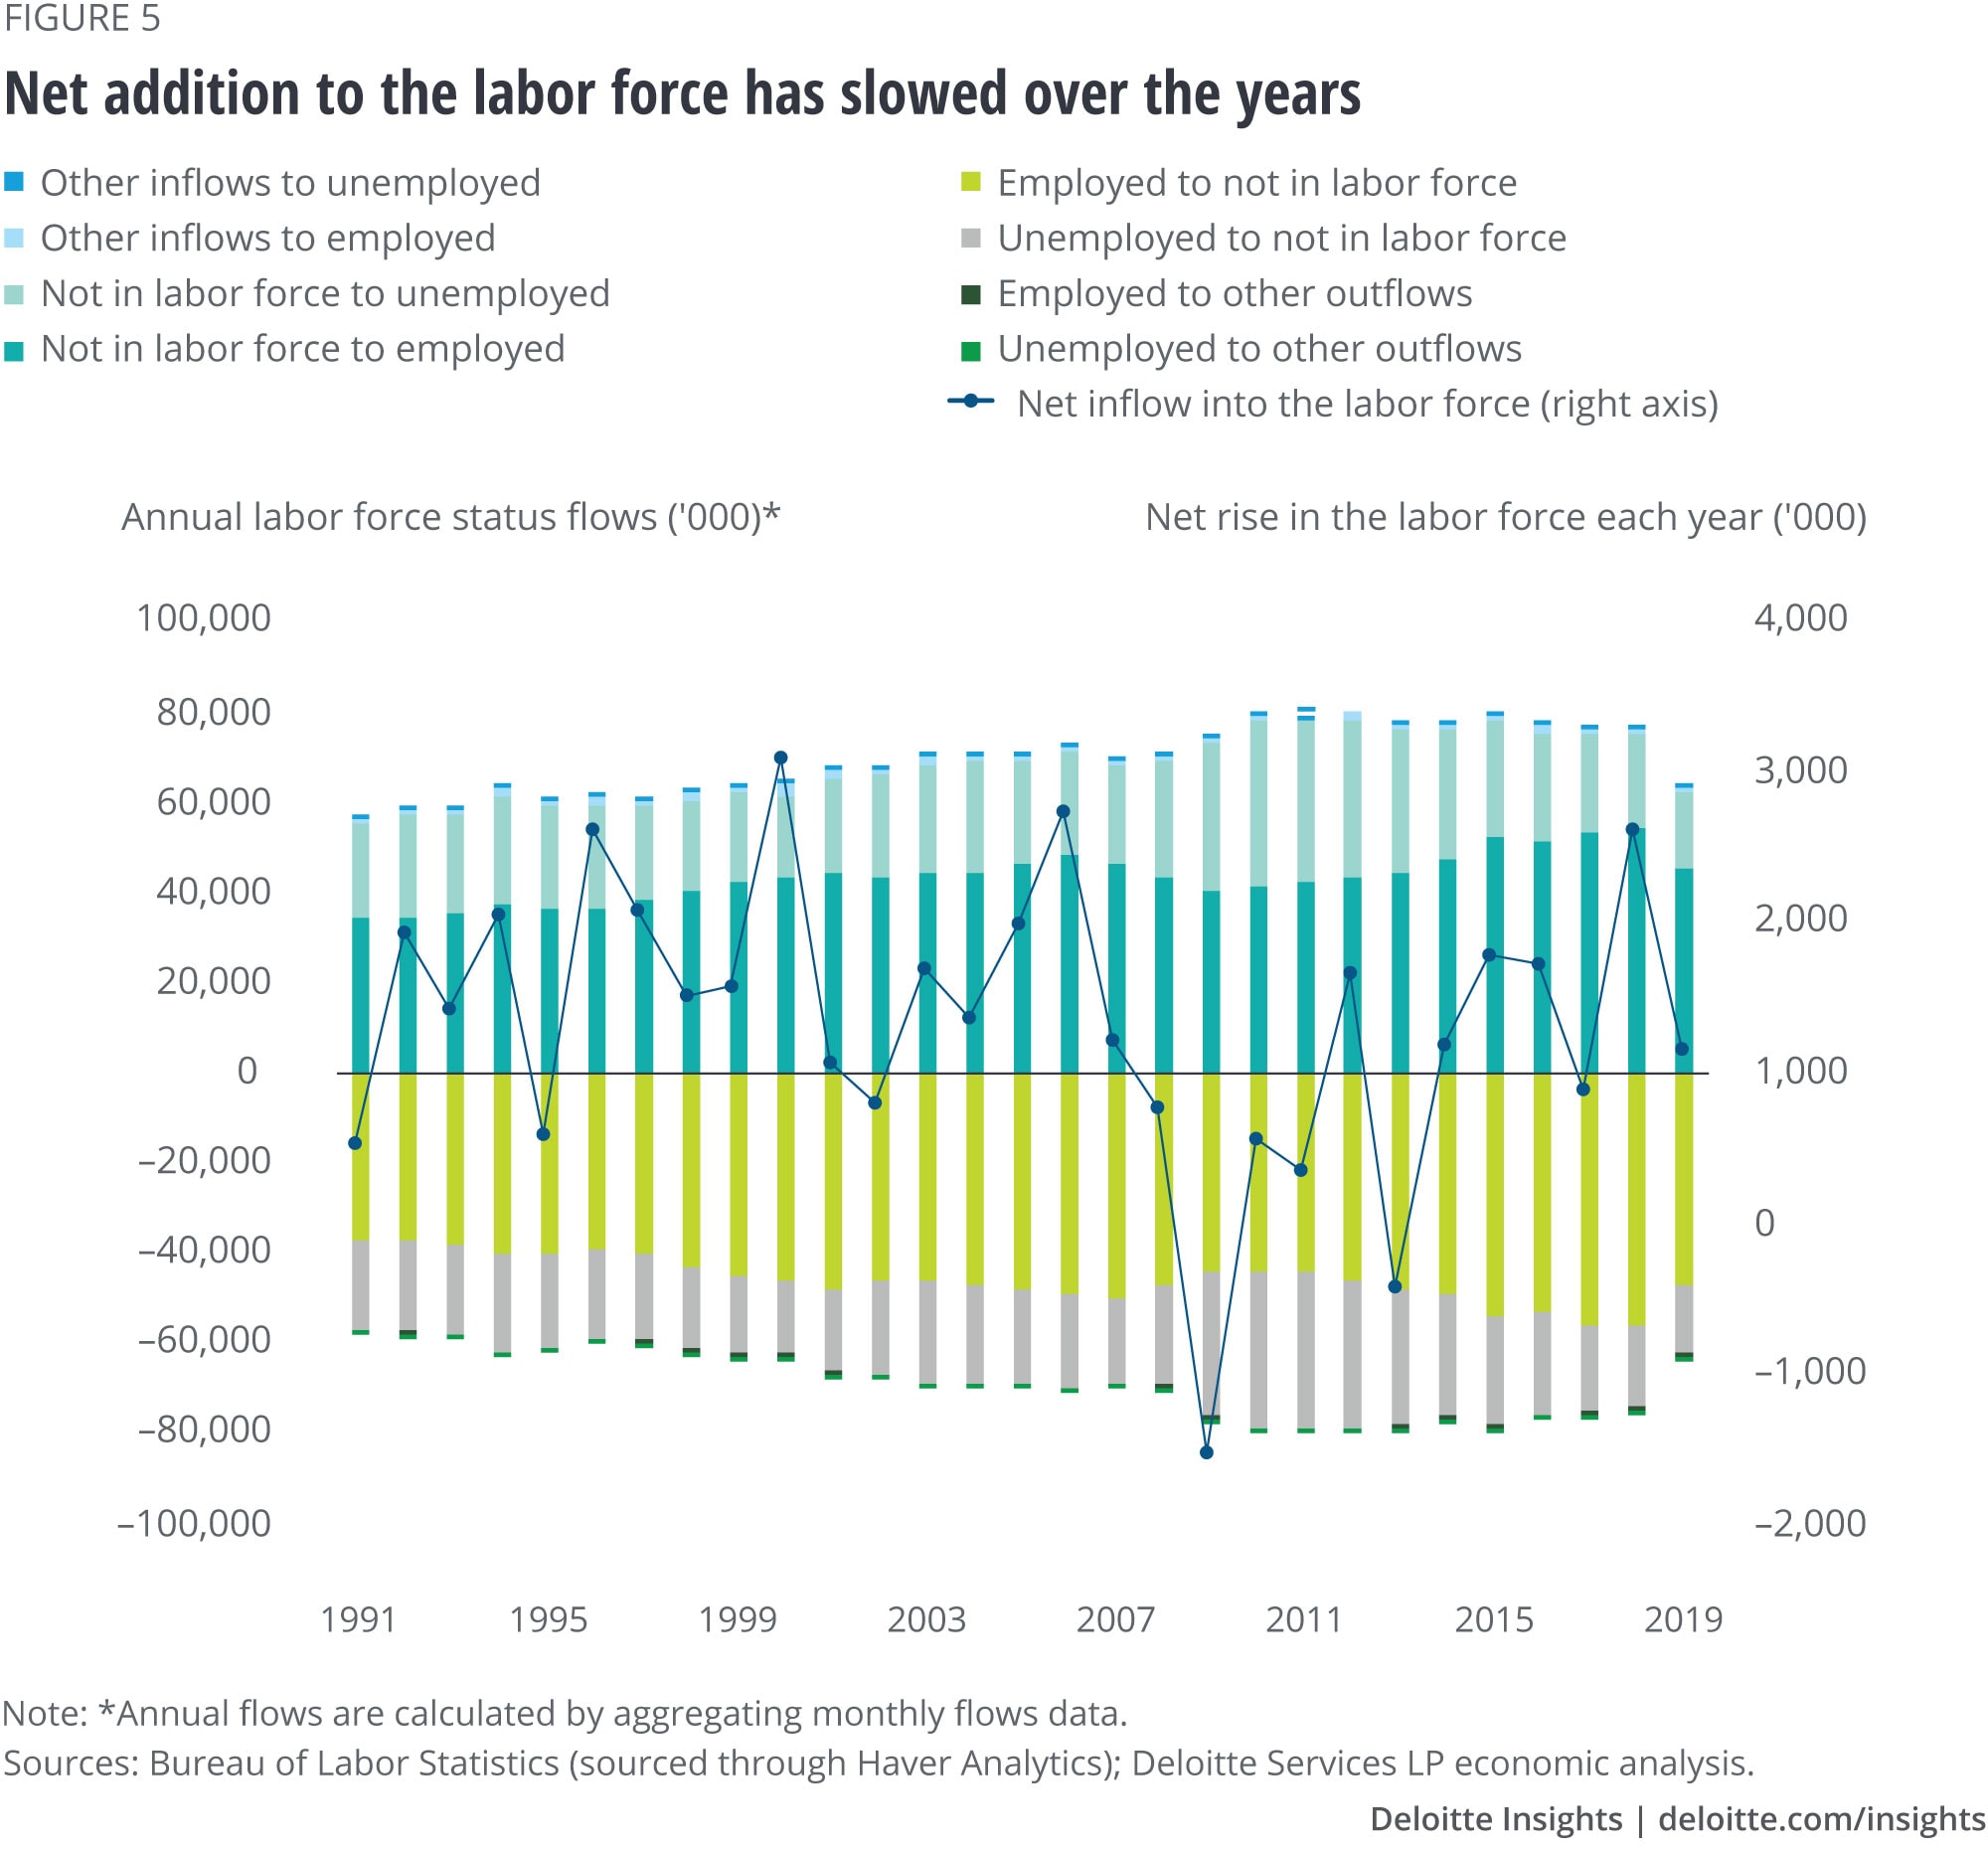
Slowing inflows of people from outside the labor force into employment has come at a time when labor force growth has slowed. The dotted line in figure 5 shows the net additions to the labor force each year since 1991; the pace has slowed over the years.10 Since 2008, 869,000 people, net of outflows, have moved into the labor force on average each year. This is far lower than in previous business cycles: 1.7 million during 1991–2000 and 1.5 million in 2001–2007. Of interest is the large number of dropouts from the labor force (see figure 6). For example, between July 2009 and October 2019, there were 4.1 million outflows per month, on average, of employed people from the labor force: Most of them are likely retirees who have left the labor force with no plans to return. And the figure for outflows is higher than in previous recoveries. Figures 5 and 6 also reveal that the number of young entrants to the labor force (“Other inflows to employed” and “Other inflows to unemployed”) have gone down. The net result of these factors is slower growth in the labor force.

What weighs on labor force growth: Demographics and lower participation
Slowing labor force growth is most likely due to two factors: More older people and fewer younger people, and declining participation rates among the younger cohorts. Between 1991 and 2018, the share in total population of those below 16 years of age fell to 19.9 percent from 23.1 percent, and those in the 16–24 years age group fell to 11.9 percent from 13.1 percent. In contrast, the share of those aged 55 years and above went up during this period. This indicates that while the shares in total population of potential and new entrants into the labor force have fallen, shares of retirees and potential retirees have gone up. This trend is likely to continue, according to population projections by the Census Bureau.11
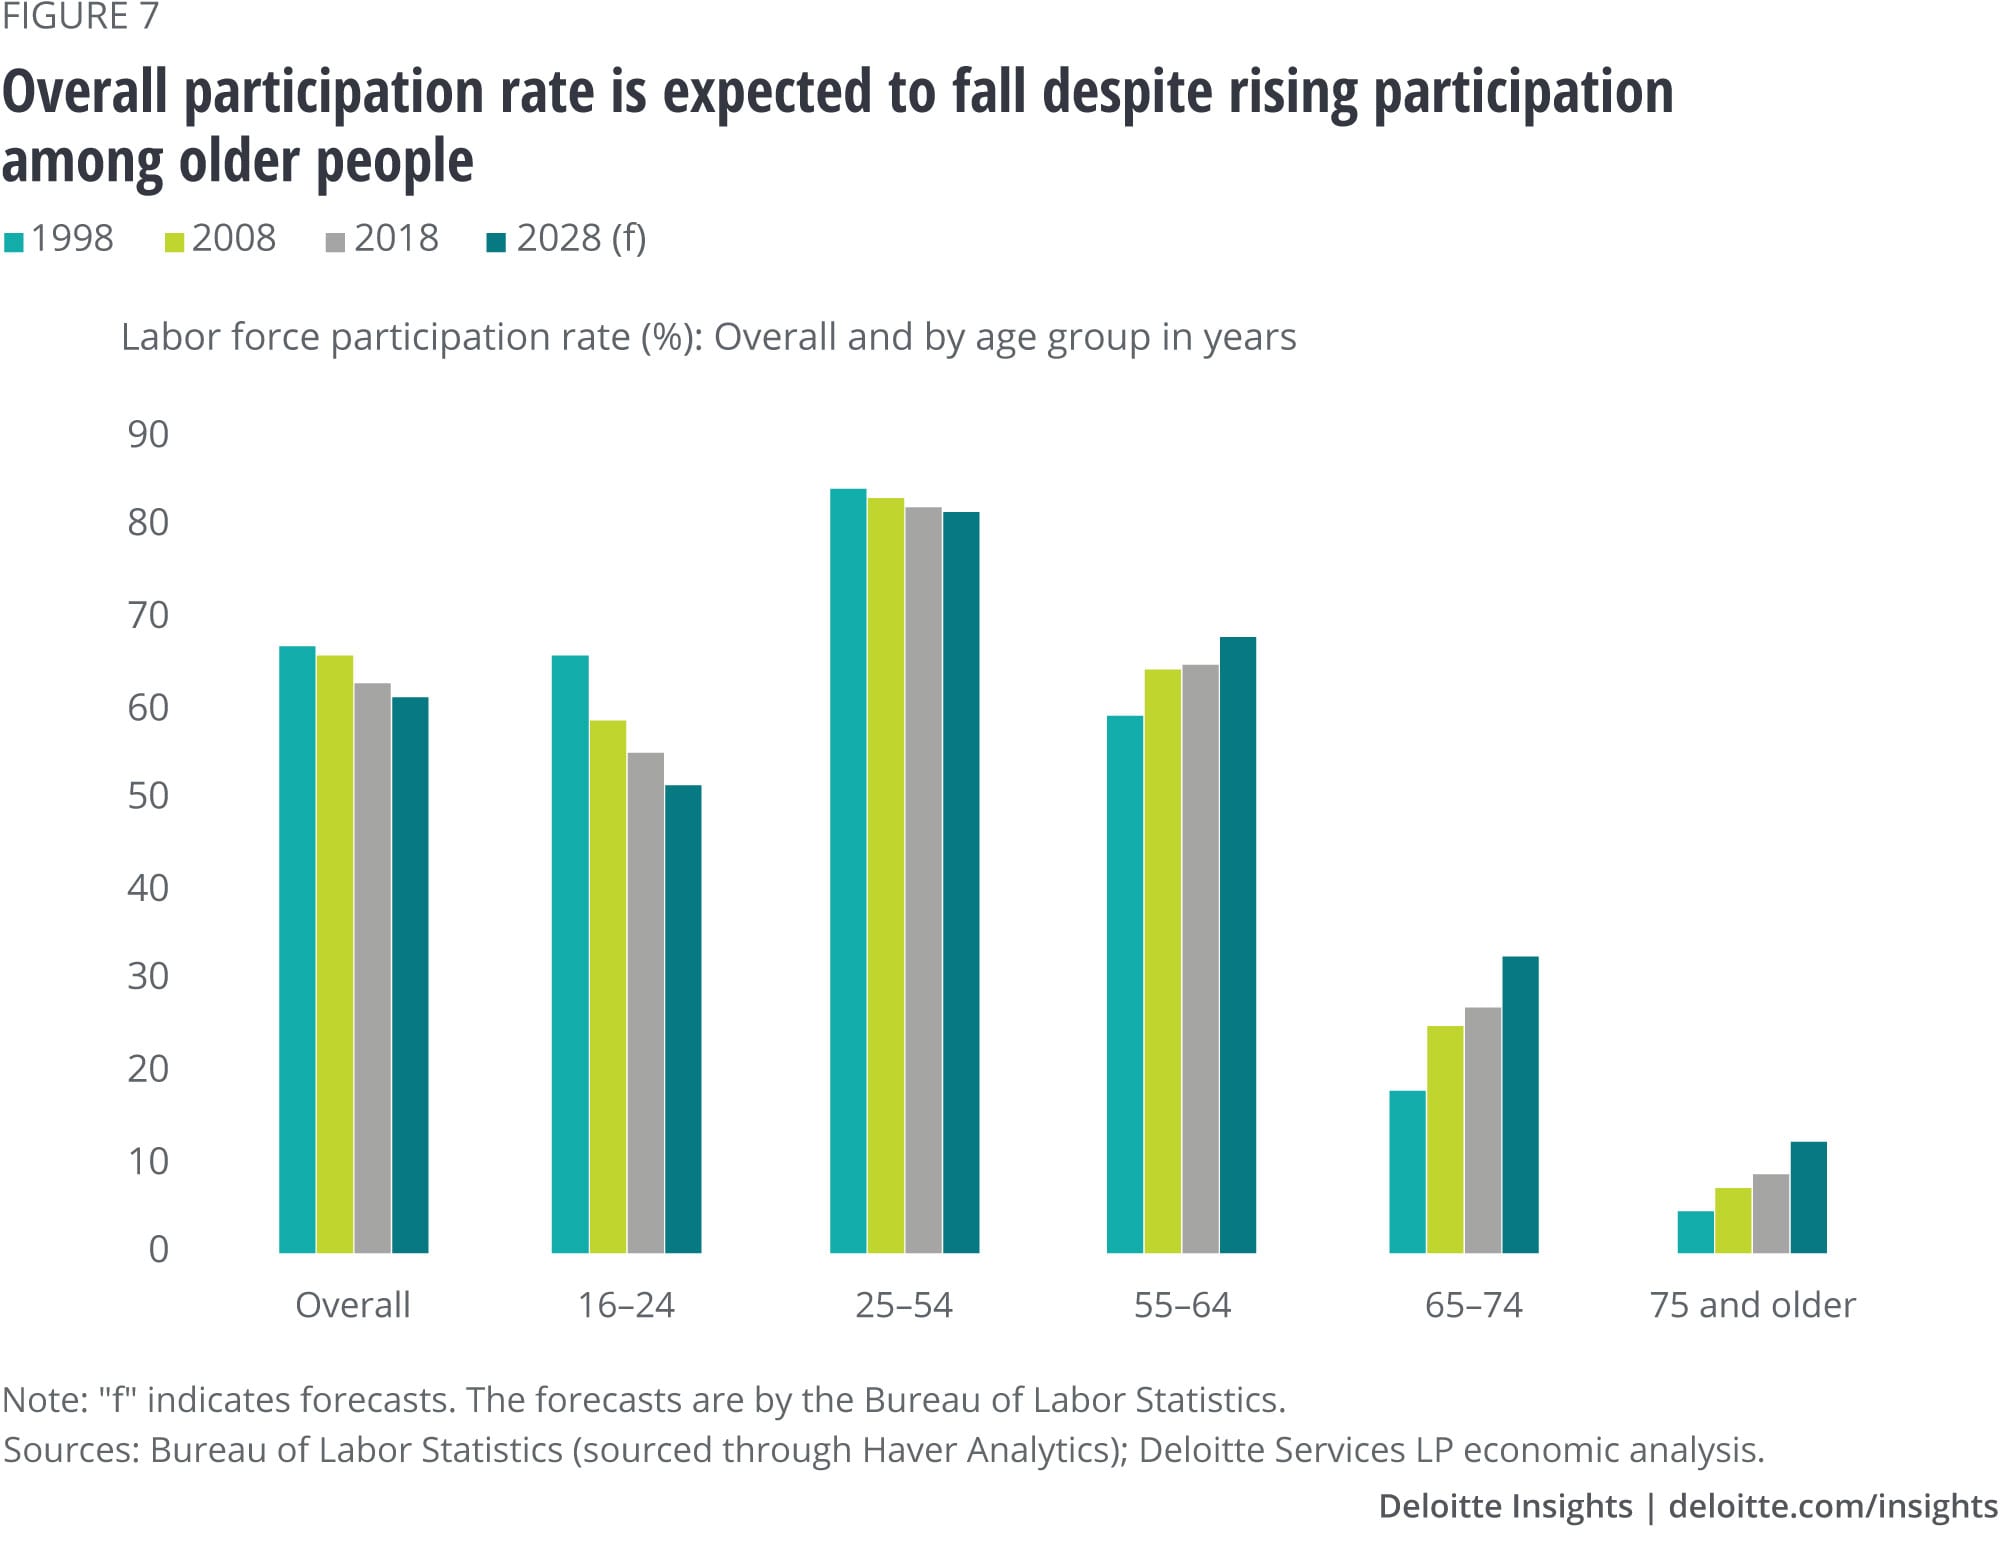
Declining shares of young people in the population has been accompanied by falling labor force participation rates among them. Figure 7 shows how participation rates have fallen for 16–24-year-olds and 25–54-year-olds. The decline among 16–24-year-olds should be a positive for the economy—young people staying in school rather than entering the labor market will increase the skills possessed by this cohort once they do enter the labor force. The fall in the participation of 25–54-year-olds, however, is more problematic. Overall, falling participation rates for these two cohorts has forced overall labor force participation rates down despite rising participation among older people. This trend is likely to continue, as projections by the BLS indicate (see figure 7).12
With unemployment and participation low, employment growth will likely slow
Current low levels of unemployment and slowing labor force growth will weigh on employment growth in the near to medium term compared to the past 10 years. According to baseline forecasts by Deloitte economists, the labor force will grow by only 1.3 percent in 2021 and by less than one-half of a percent between 2022 and 2024. This will contribute to a decline in the average monthly change in employment from 121,000 in 2020 and 32,000 in 2021 from an estimated 203,000 this year.13 Not only will this disturb regular observers of the monthly employment release, it will also likely weigh on those whose businesses depend on growing consumer spending—ranging from retailers to auto manufacturers and from restaurants to home builders. However, it is not just businesses that provide goods and services directly to consumers that will be impacted. Lower employment and consumer spending growth means that all businesses could be dealing with a slower-growing economy and may have to adjust their expectations and plans accordingly.
More from the Economics collection
-
Global Weekly Economic Update Article3 days ago
-
China economic outlook, February 2023 Article1 year ago
-
What to expect when you’re expecting … a recession Article5 years ago
-
Eurozone economic outlook, September 2024 Article2 months ago
-
Canada Economic Outlook Article4 years ago
-
United States Economic Forecast Q3 2024 Article2 months ago


