
The shifting sands of employment and occupations in American manufacturing Economics Spotlight, November 2019
7 minute read
23 November 2019
The role of manufacturing in the economy may have declined, but it is still a sizeable employment generator. For firms seeking to navigate the changes in manufacturing, it is important to first understand trends in employment and occupations in the sector over the years.
Manufacturing no longer occupies the same pedestal in the US economy that it used to. At 11.3 percent of GDP in 2018, the sector’s contribution has shrunk by more than half over the past 50 years.1 And given the onslaught of technological advances and continued globalization, it is hard to imagine that manufacturing will ever return to its once-dominant role. Despite this downward trend, with 12.9 million people still on its payrolls, the sector is still a major employment generator and will likely remain an important contributor to the labor market.
Learn more
Explore the Economics Spotlight collection
Subscribe to receive related content
Download the Deloitte Insights and Dow Jones app
For business leaders trying to understand trends in the manufacturing workforce so that they may be able to ride or capitalize on the shifts occurring within the sector, this article provides insights into how employment and occupations within manufacturing have evolved. Such an analysis, with comparisons to the wider economy, may perhaps offer hints of what changes we can expect in future.
Bureau of Labor Statistics to the rescue
To gauge employment trends, we used the establishment survey data from the Bureau of Labor Statistics’ (BLS’) Current Employment Situation (CES) program.2 The monthly payrolls data from the survey helps throw light on job creation in the economy and the role of different sectors.
Data on occupations is available from the Occupational Employment Statistics (OES) by BLS.3 In OES, annual data on employment and wages is available for 22 major occupations (and key suboccupations) from 1999 to 2018. Data prior to 1999 uses a different classification for occupations and, hence, is not comparable. Also, despite BLS’ involvement in generating both datasets, employment numbers from these two surveys do not match exactly due to differences in the nature and collection of OES and CES data.
Manufacturing employment is on a broad downward trend
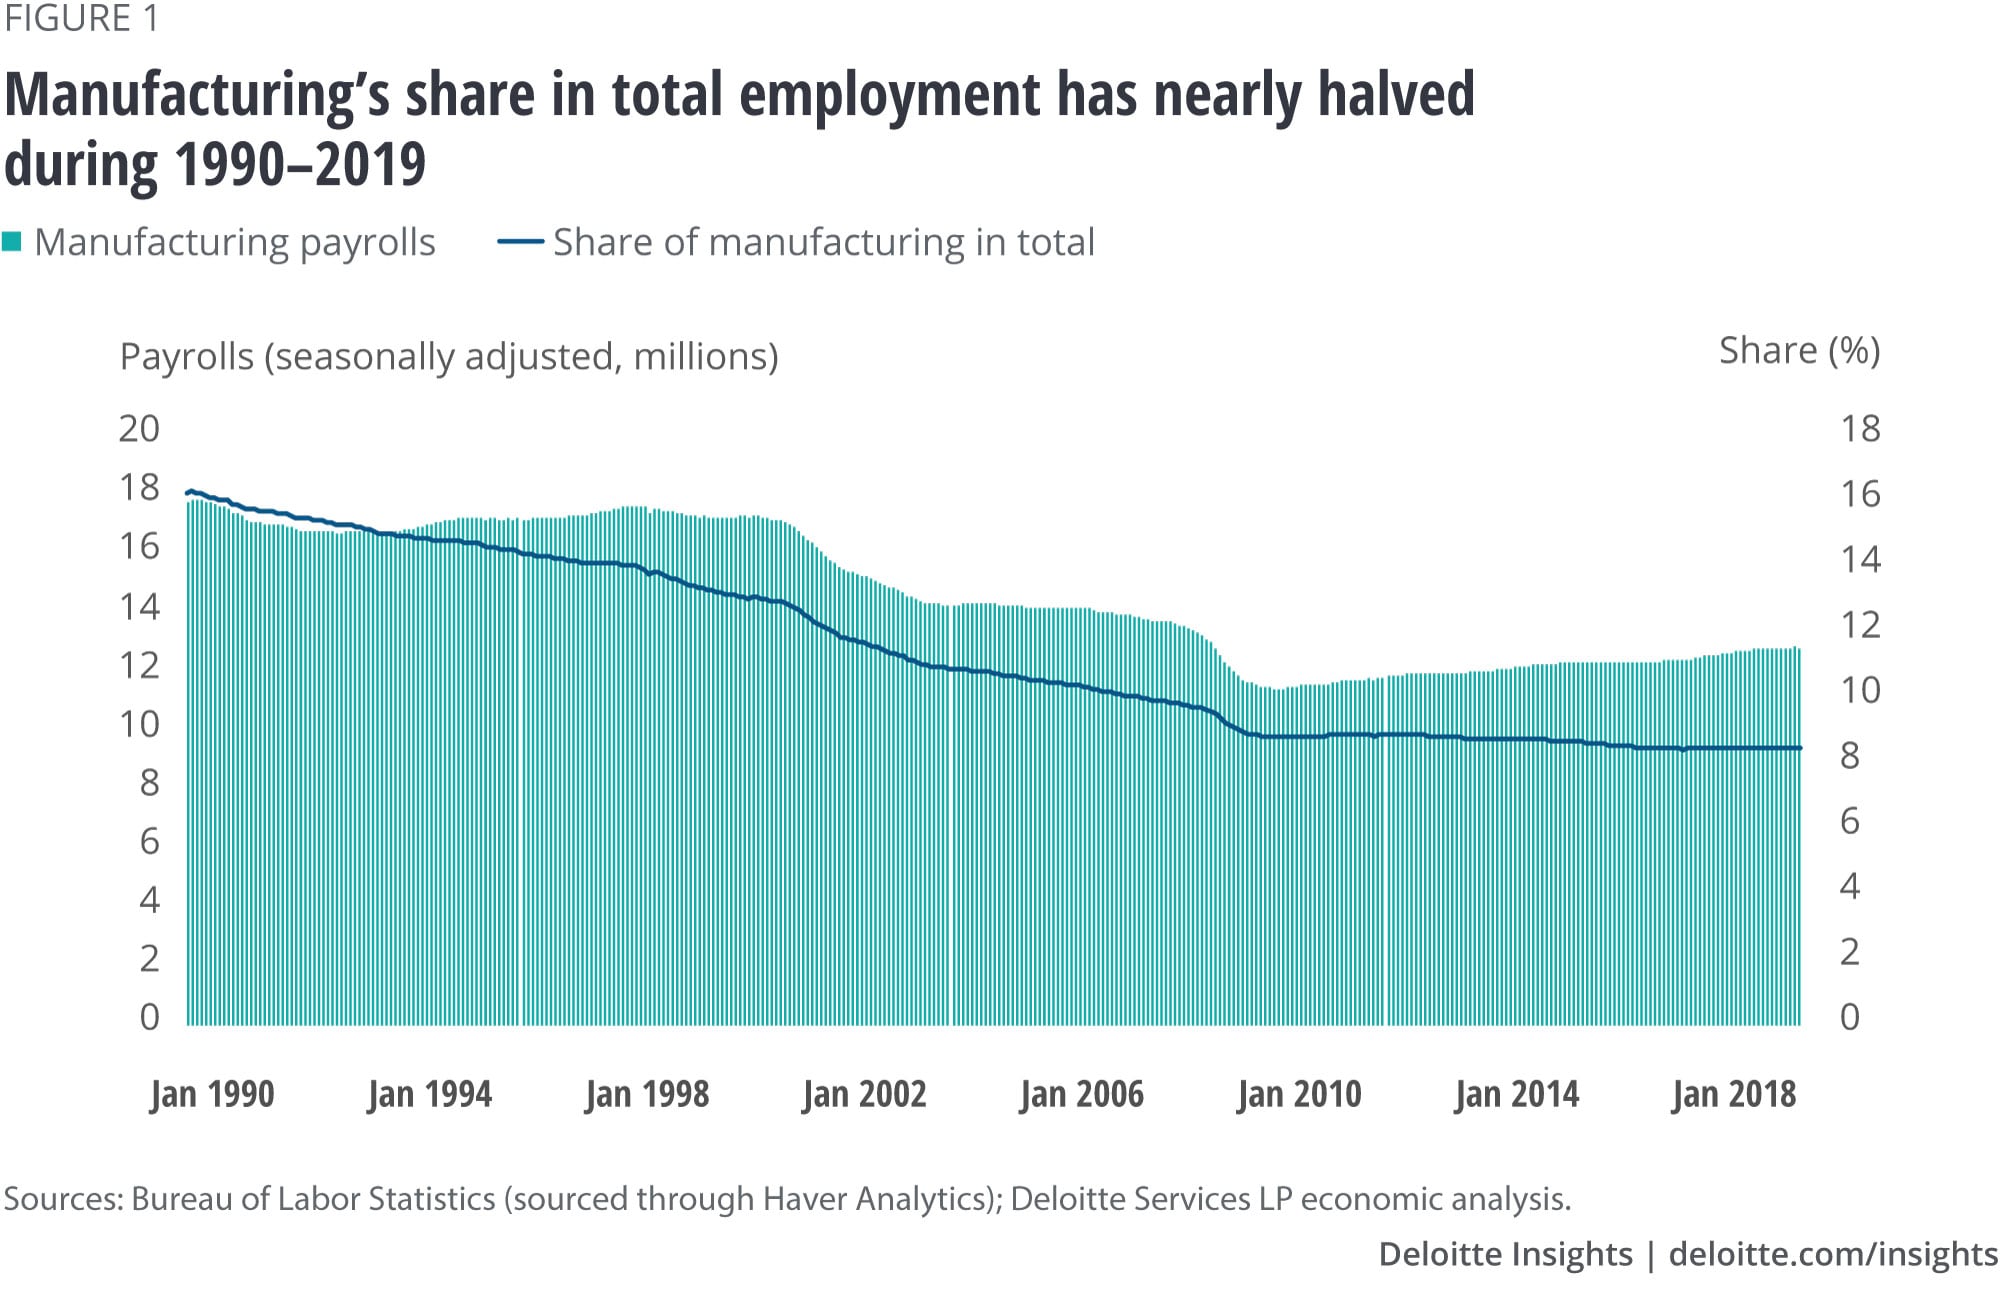
Employment in manufacturing has been falling steadily over the years, in line with the sector’s declining share in GDP. So, even though the 12.9 million people currently on the sector’s payrolls may seem like a large figure, it is lower than the 17.8 million people employed back in January 1990.4 In fact, between 1990 and 2019, manufacturing payrolls fell at an average annual rate of 1.1 percent, a stark contrast to employment growth in the wider economy (1.1 percent on average per year) during this period.5 No wonder then that manufacturing’s share in total employment has nearly halved during 1990–2019 (figure 1).
The decline in manufacturing jobs has been more than made up by gains in services. Payrolls in the private services sector grew by 1.6 percent on average per year during this period. Construction, a smaller part of the wider goods-producing industry than manufacturing, also witnessed a broad increase in payrolls during this period despite the impact of the Great Recession.
Only food manufacturing witnessed a rise in employment during 1990–2019
Manufacturing is broadly subdivided into durable goods and nondurable goods. And employment has gone down in both. While payrolls in durable goods manufacturing fell at an average annual rate of 1 percent during 1990–2019, the decline was slightly more for nondurable goods (–1.3 percent). Consequently, the share of durable goods in total manufacturing employment went up slightly during this period. The payrolls data reveals that within both these subdivisions, payrolls fell for all key sectors between 1990 and 2019, except food manufacturing where payrolls grew by 0.3 percent on average per year (figure 2). Figure 2 also shows that within nondurable manufacturing, the fastest decline in employment during this period was in apparel (–7.1 percent), followed by textile mills (–5 percent). Within durable goods, primary metals (–2 percent) and computer and electronic products (–1.9 percent) witnessed the fastest declines in employment.

Given these trends, shares in employment of key sectors have changed over the years (figure 3). The most notable of these, as can be seen in figure 3, is the rise in share of food manufacturing in nondurable goods employment—to 34.2 percent from 21.7 percent during 1990–2019. In contrast, apparel’s share fell sharply to a mere 2.3 percent from 13 percent over this period. Within durable goods, shares in employment fell the most for primary metals, and computer and electronic products.
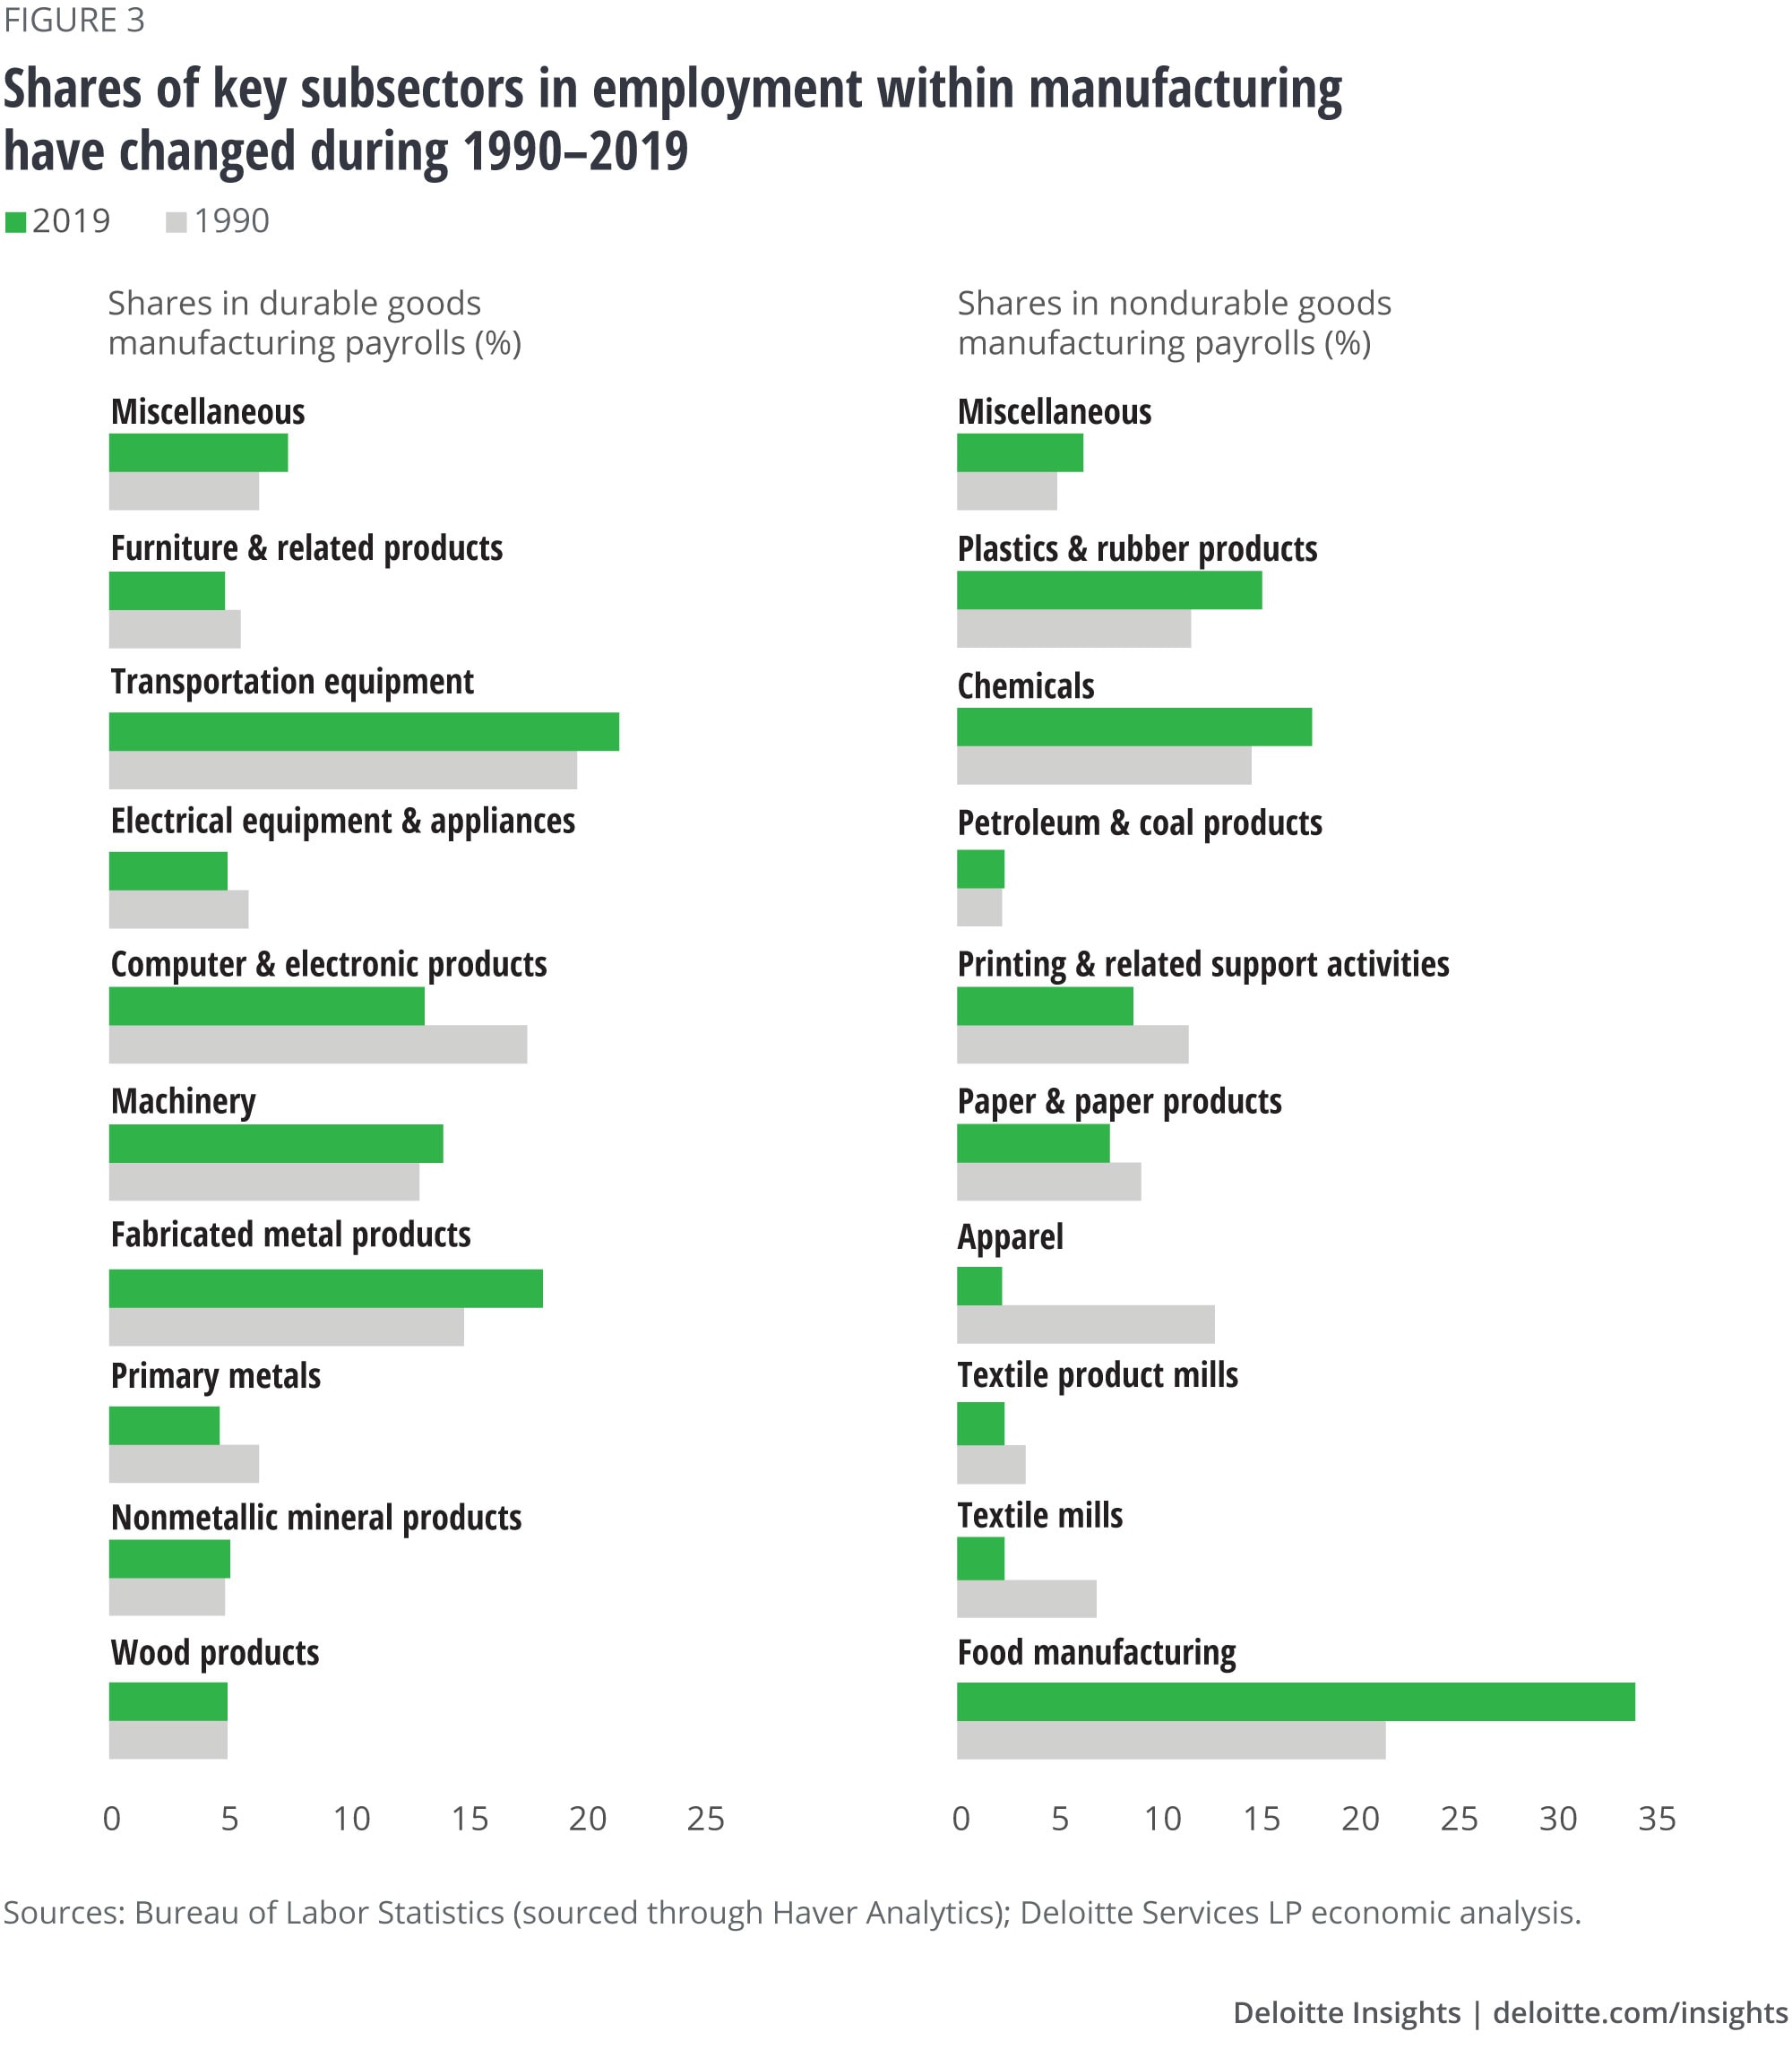
The declining fortunes of some sectors such as apparel and textiles are likely due to the liberalization of global trade and investment during this period, thereby making sense for businesses in the United States to import such products from factories in Asia and Latin America than produce at home. Aiding this trend are technological progress and the spread of global value chains in manufacturing. Food manufacturing, on the other hand, is more likely to take place closer to where the demand is—in this case, American customers. And demand for food and beverages is sizable in the United States: In 2018, for example, personal consumption expenditure on food and beverages for off-premise consumption, and on food services together added up to US$1.8 trillion.
Production occupations take a hit; office and administrative support occupations fall by more
Analysis of OES employment data reveals that production occupations (assemblers and fabricators, machinists and tool and die makers, metal and plastic machine workers, etc.) form the largest share of manufacturing workers.6 In 2018, 6.4 million people were employed in production occupations, accounting for 51.3 percent of total employment in the sector. This large share is primarily due to the nature of the sector: Manufacturing is a part of the overall goods-producing industry in the economy. In contrast, the share of production occupations in total employment in the economy is much smaller (6.3 percent in 2018) because nearly four-fifths of GDP is services, and the share of production occupations in services’ employment is low. While production towers over others in manufacturing employment, occupations such as office and administrative support, transport and material moving, and architecture and engineering also have notable shares (figures 4 and 5).
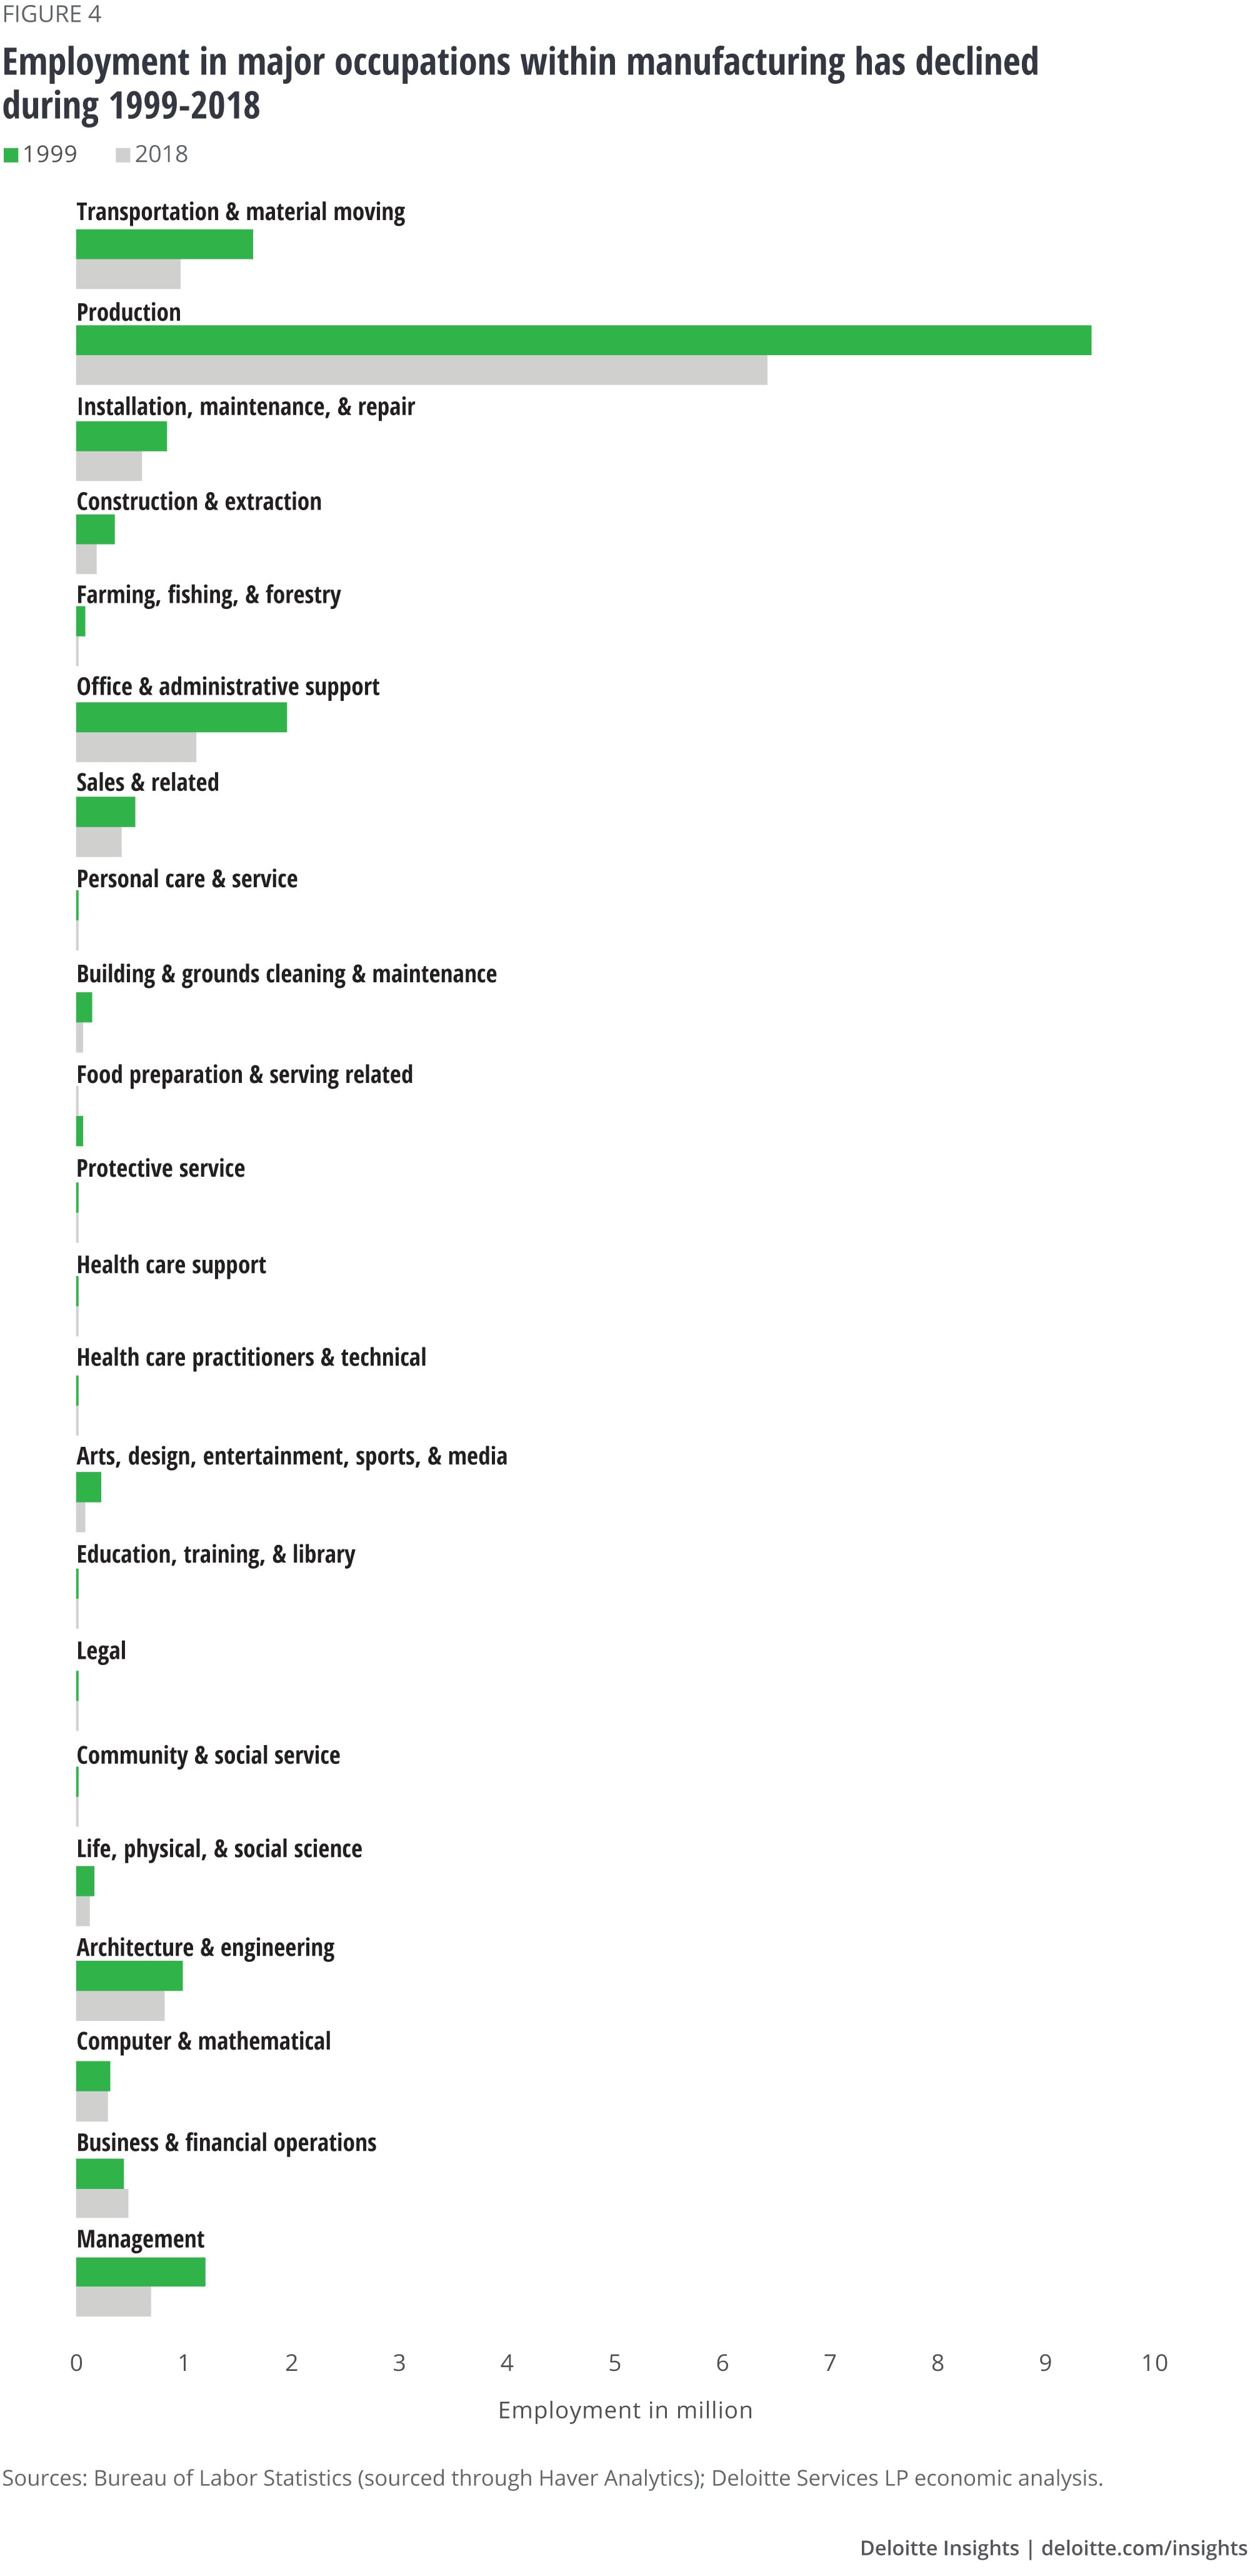
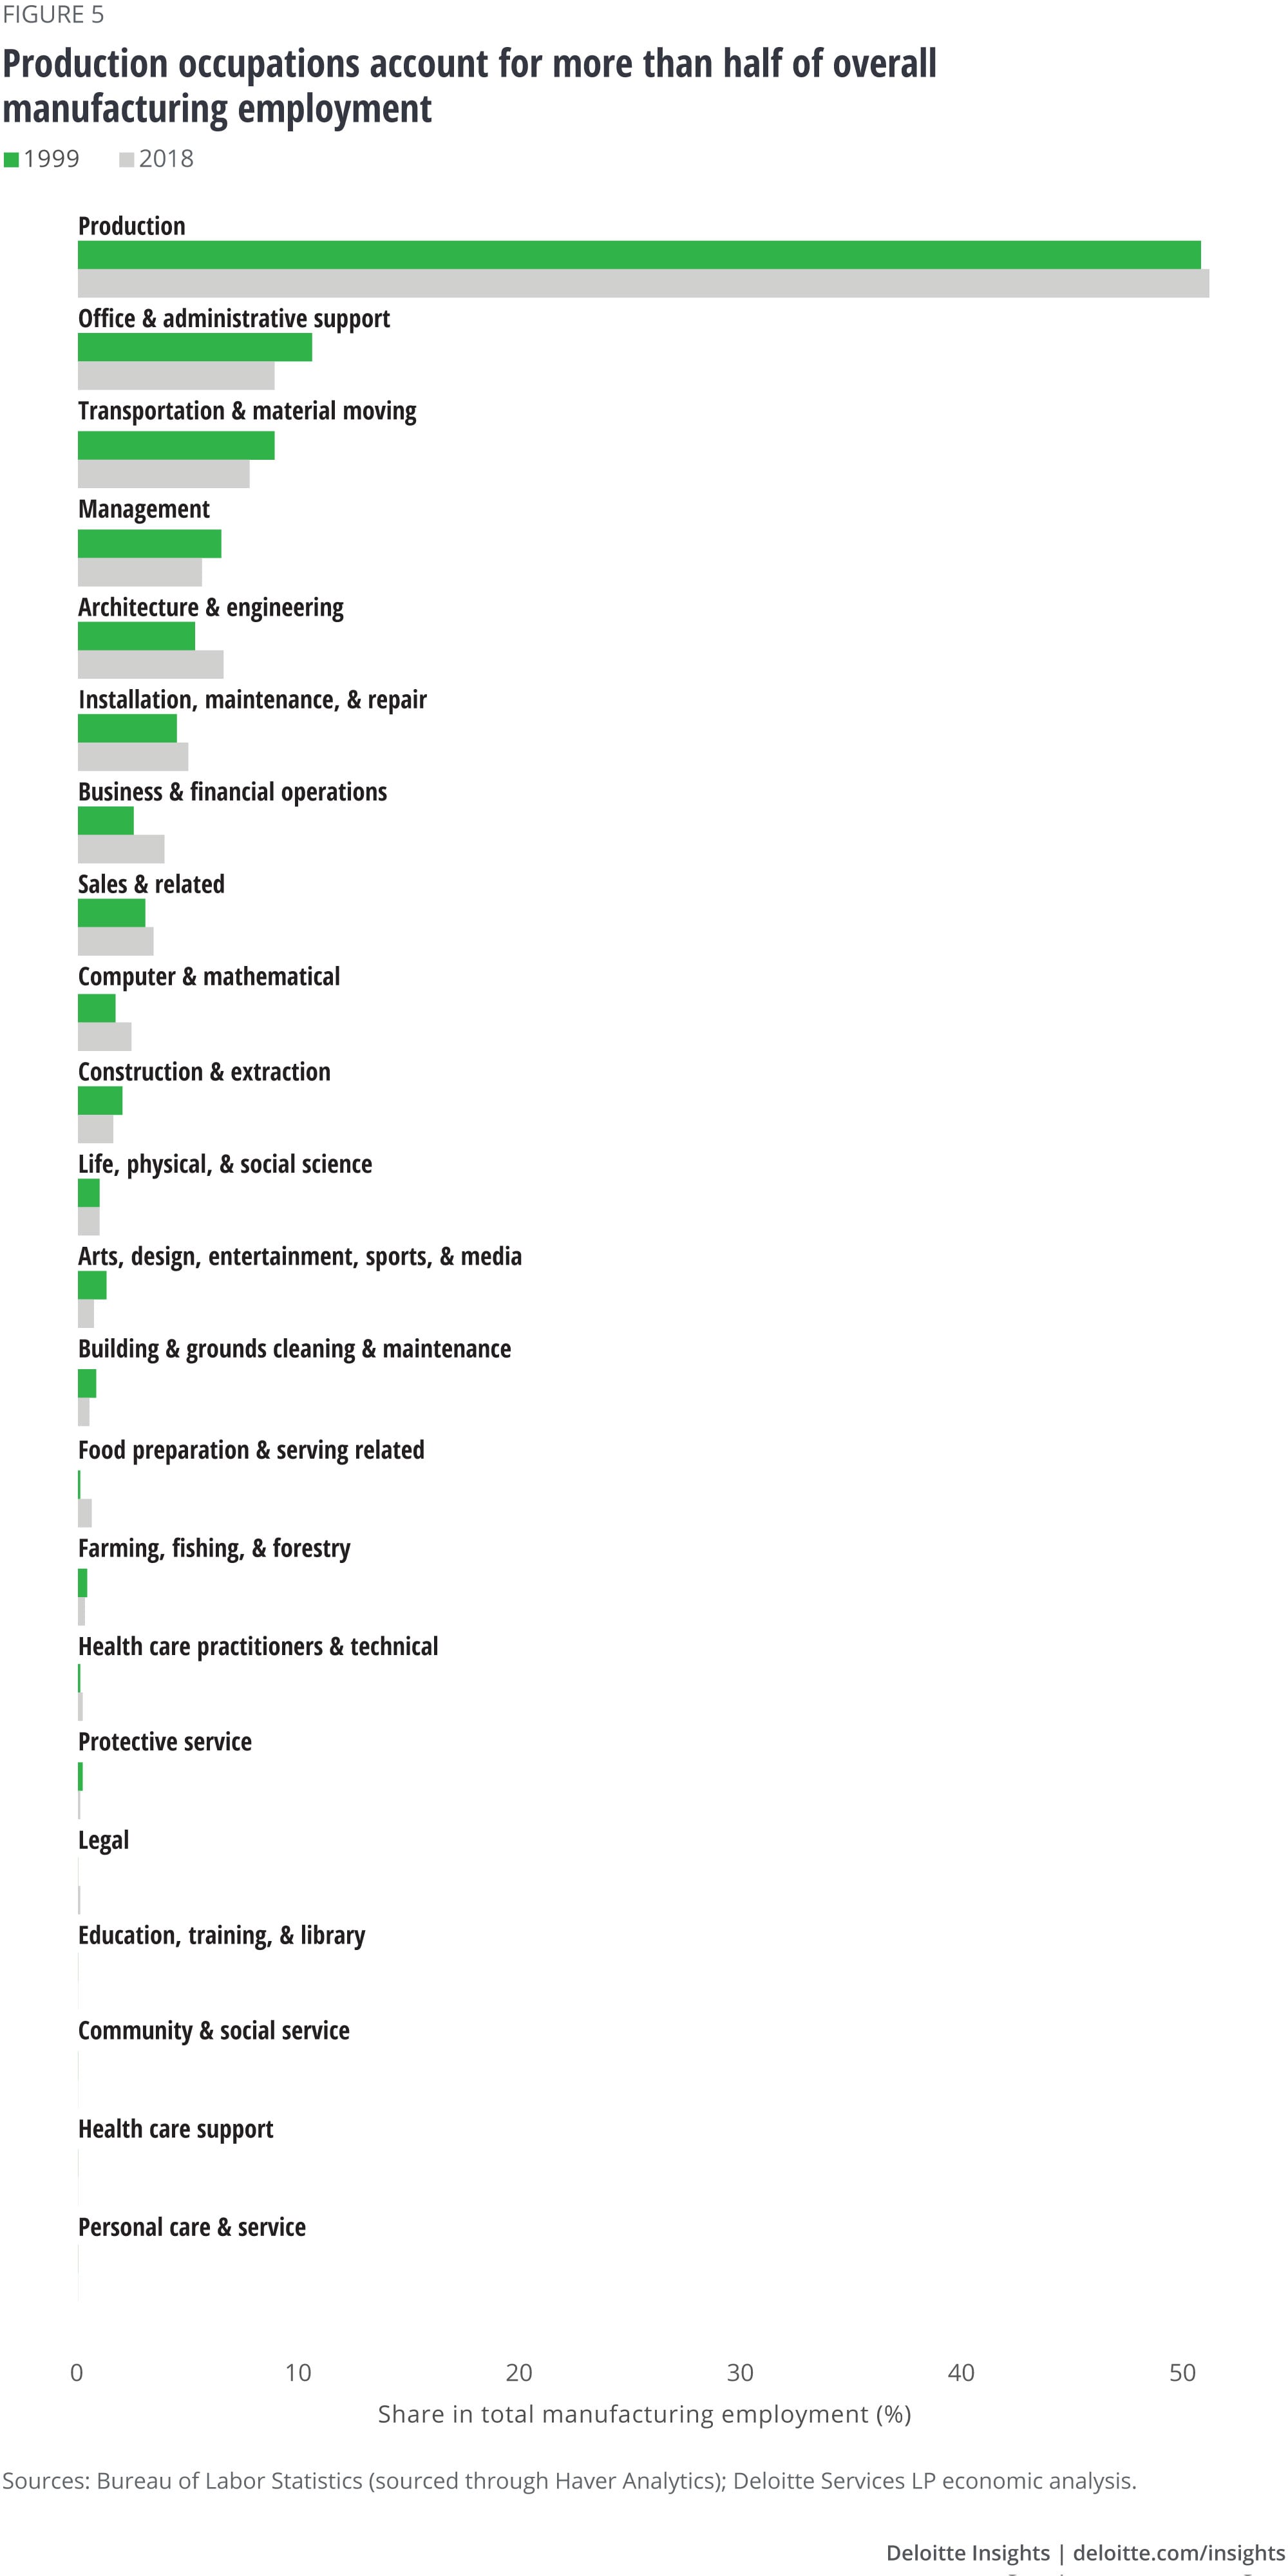
Between 1999 and 2018—the period for which the OES data is comparable (see the sidebar, “Bureau of Labor Statistics to the rescue”)—employment fell for most occupations within manufacturing. In production occupations, for example, employment fell by an average annual rate of 2 percent during this period, roughly the same as overall manufacturing employment. Employment fell faster for office and administrative support, transportation and material moving, and management (figures 4 and 6). Consequently, their shares in total manufacturing employment have declined (figure 5). Employment in office and administrative support occupations, for example, fell by an average annual rate of 2.8 percent during 1999–2018; as a result, its share in manufacturing employment fell to 8.9 percent from 10.6 percent during this period.
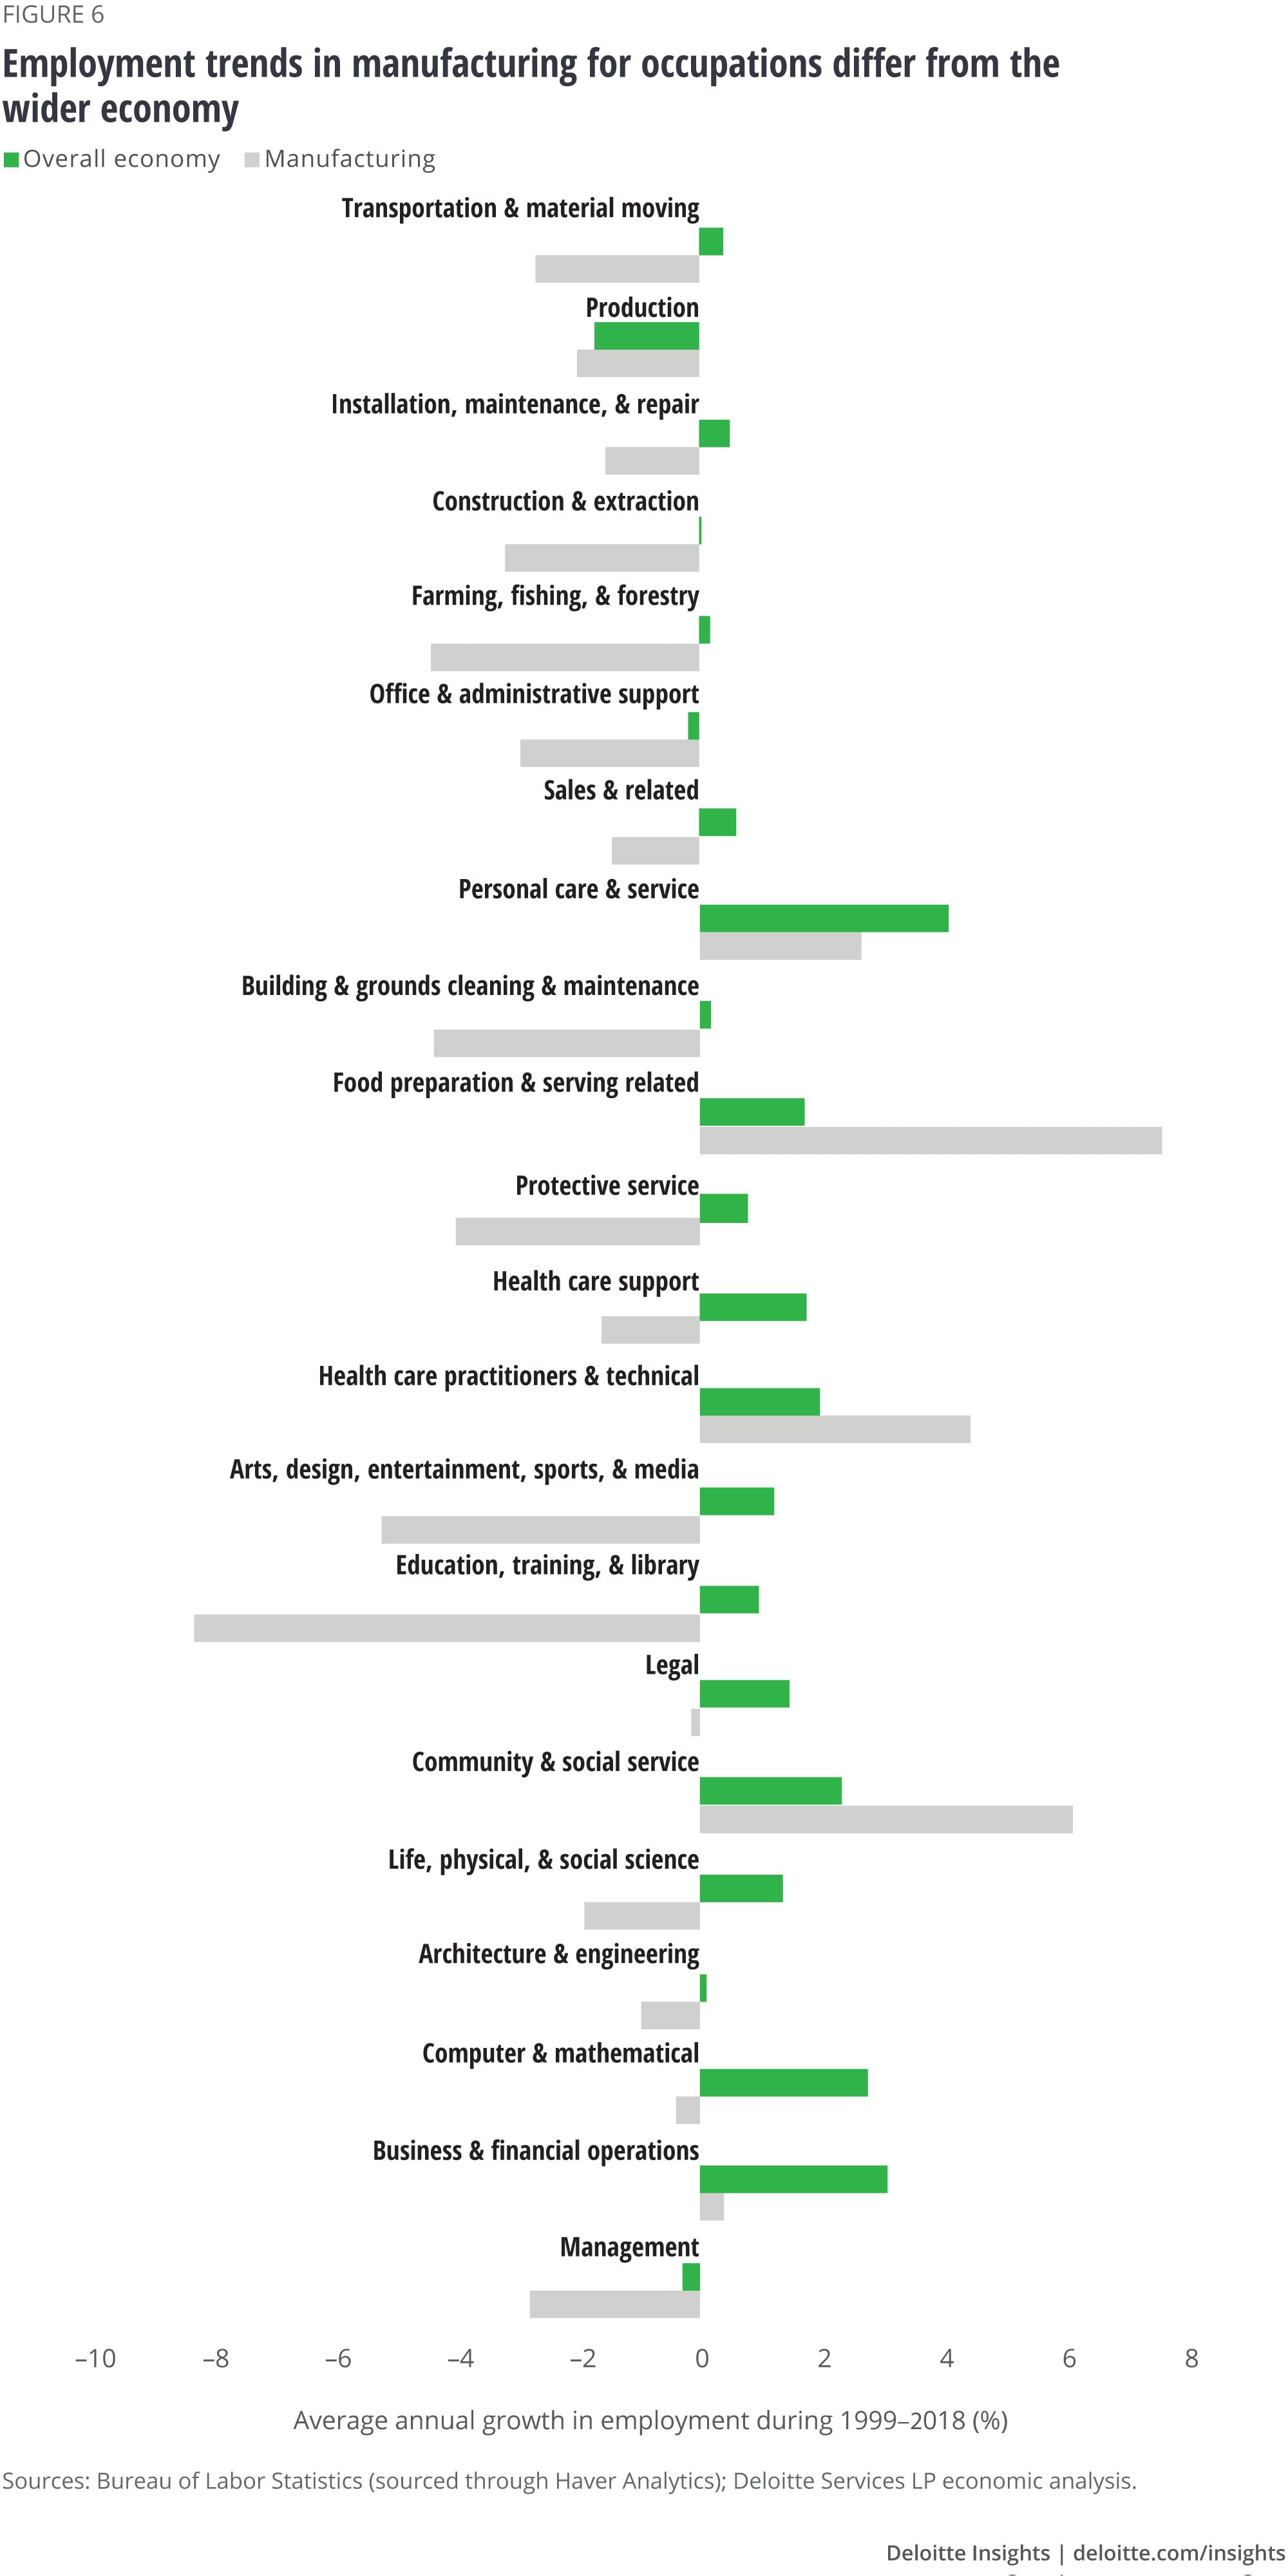
The decline in the fortunes of office and administrative support occupations is not restricted to manufacturing—it is true for the wider economy as well (figure 6). It is likely that with the advancement of technology—including office-related ones such as emails, word processing, statistical packages, and design software—office- and administrative-related workloads have gone down, thereby denting employment.7 Automation will likely boost this trend in future.
Occupations where employment has increased in manufacturing during 1999–2018 are business and financial operations, community and social service, health care practitioners and technical occupations, food preparation and serving, and personal care and services. Given their low share in manufacturing employment (figure 5), however, the surge in numbers in these occupations was hardly able to dent the slide in overall manufacturing employment.
Preparing for the future
Despite the decline in the sector’s workforce, occupations within manufacturing haven’t changed drastically over the years. Production occupations, for example, still make up half of the workforce in the sector, the same as nearly 20 years back. There are, however, subtle changes at play due to advancements in technology. The share of administrative-related occupations in total manufacturing employment has gone down, while that of computer and mathematical operations have increased—trends that are in line with that of the wider economy. These trends are likely to continue, given further advancements in automation and artificial intelligence, thereby raising demand for related skills.8 Yet, this will also translate to challenges for businesses as they not only have to navigate technology-driven disruptions, but also engage in reskilling talent, even as they strive to create an innovative environment for higher-skilled professionals entering the workforce.
More from the Economics collection
-
Monetary policy in advanced economies Article5 years ago
-
Rising corporate debt: Should we worry? Article5 years ago
-
United States Economic Forecast Q4 2024 Article1 week ago
-
Global Weekly Economic Update Article4 days ago
-
A view from London Article6 days ago
-
Canada Economic Outlook Article4 years ago


