Back to basics: Board committees has been saved
Perspectives
Back to basics: Board committees
Board Practices Quarterly, June 2022
By Natalie Cooper, Bob Lamm, and Randi Val Morrison
Topics such as cybersecurity, human capital, climate, and political contributions that are associated with the seemingly limitless umbrella of “environmental, social, and governance” (ESG) are becoming standing items on many board agendas. This growing and ever-evolving list of issues that companies are expected to effectively manage is causing many boards to consider what it may mean for their oversight role and how to maintain and/or enhance oversight effectiveness. For many boards, this means taking a fresh look at their committee structure and practices to determine whether they are keeping pace with the board’s expanding and changing responsibilities and priorities or whether any changes may be warranted, such as adding new committees; revising committee charters; reallocating oversight delegation across the board and its committees; or modifying committee meeting formats (e.g., frequency or length).
This issue of Board Practices Quarterly presents findings from a May 2022 survey of Society for Corporate Governance members representing nearly 180 public companies. The intent of the survey was to understand current board committee structure, composition, and related practices, and how some of these practices have evolved over the past year.
Select findings
Respondents, primarily corporate secretaries, in-house counsel, and other in-house governance professionals, represent public companies of varying sizes and industries.1 The findings pertain to these companies and where applicable, commentary has been included to highlight differences among respondent demographics. The actual number of responses for each question is provided.
Download complete findings as well as results by respondent demographic in boxes above.
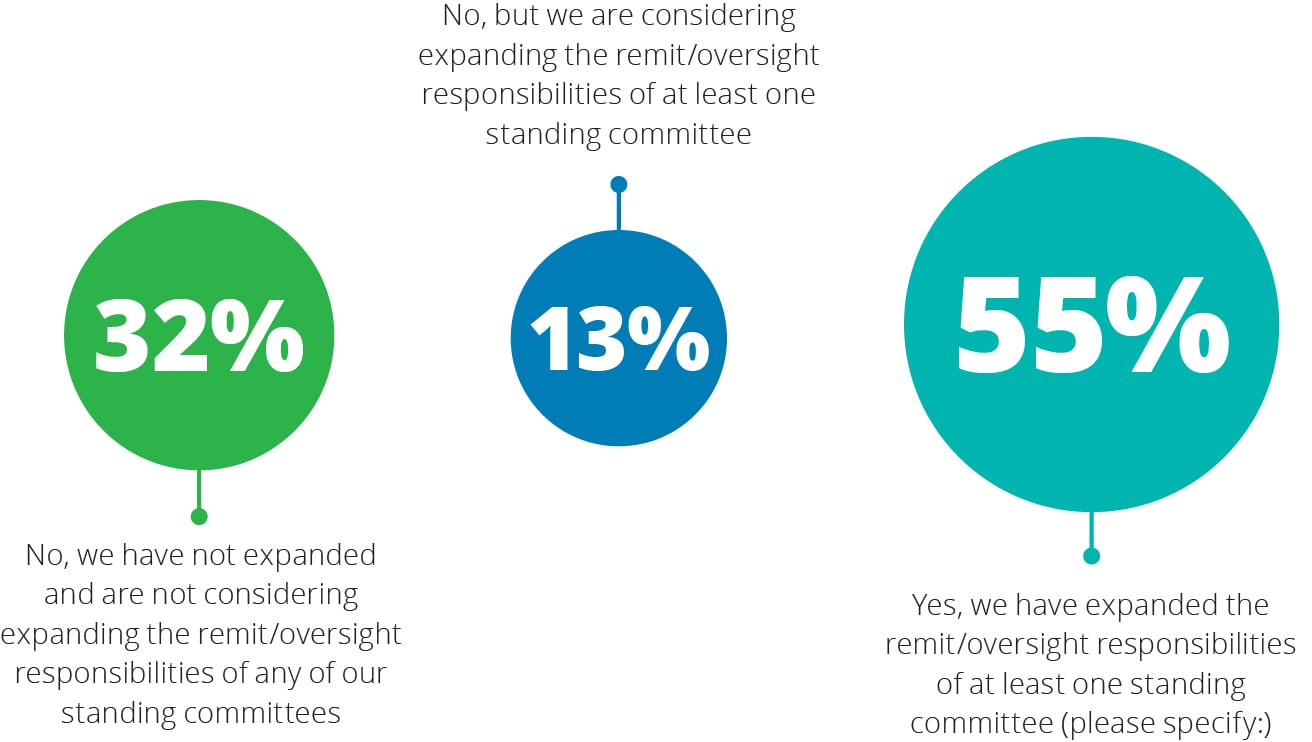
Has your board formally expanded (i.e., by resolution and/or changes to committee charter) the remit/ oversight responsibilities of any existing standing committees in the past year? (For example, expansion of the compensation committee to include human capital management oversight or expansion of the nominating and governance committee to include sustainability oversight) (164 responses)
55% of respondents reported their board expanded oversight responsibilities of one or more of its standing board committees. Many respondents indicated that their boards expanded committee oversight responsibilities to include ESG, either by delegating individual topics to specific committees or by delegating ESG as a whole to the nominating and governance committee.
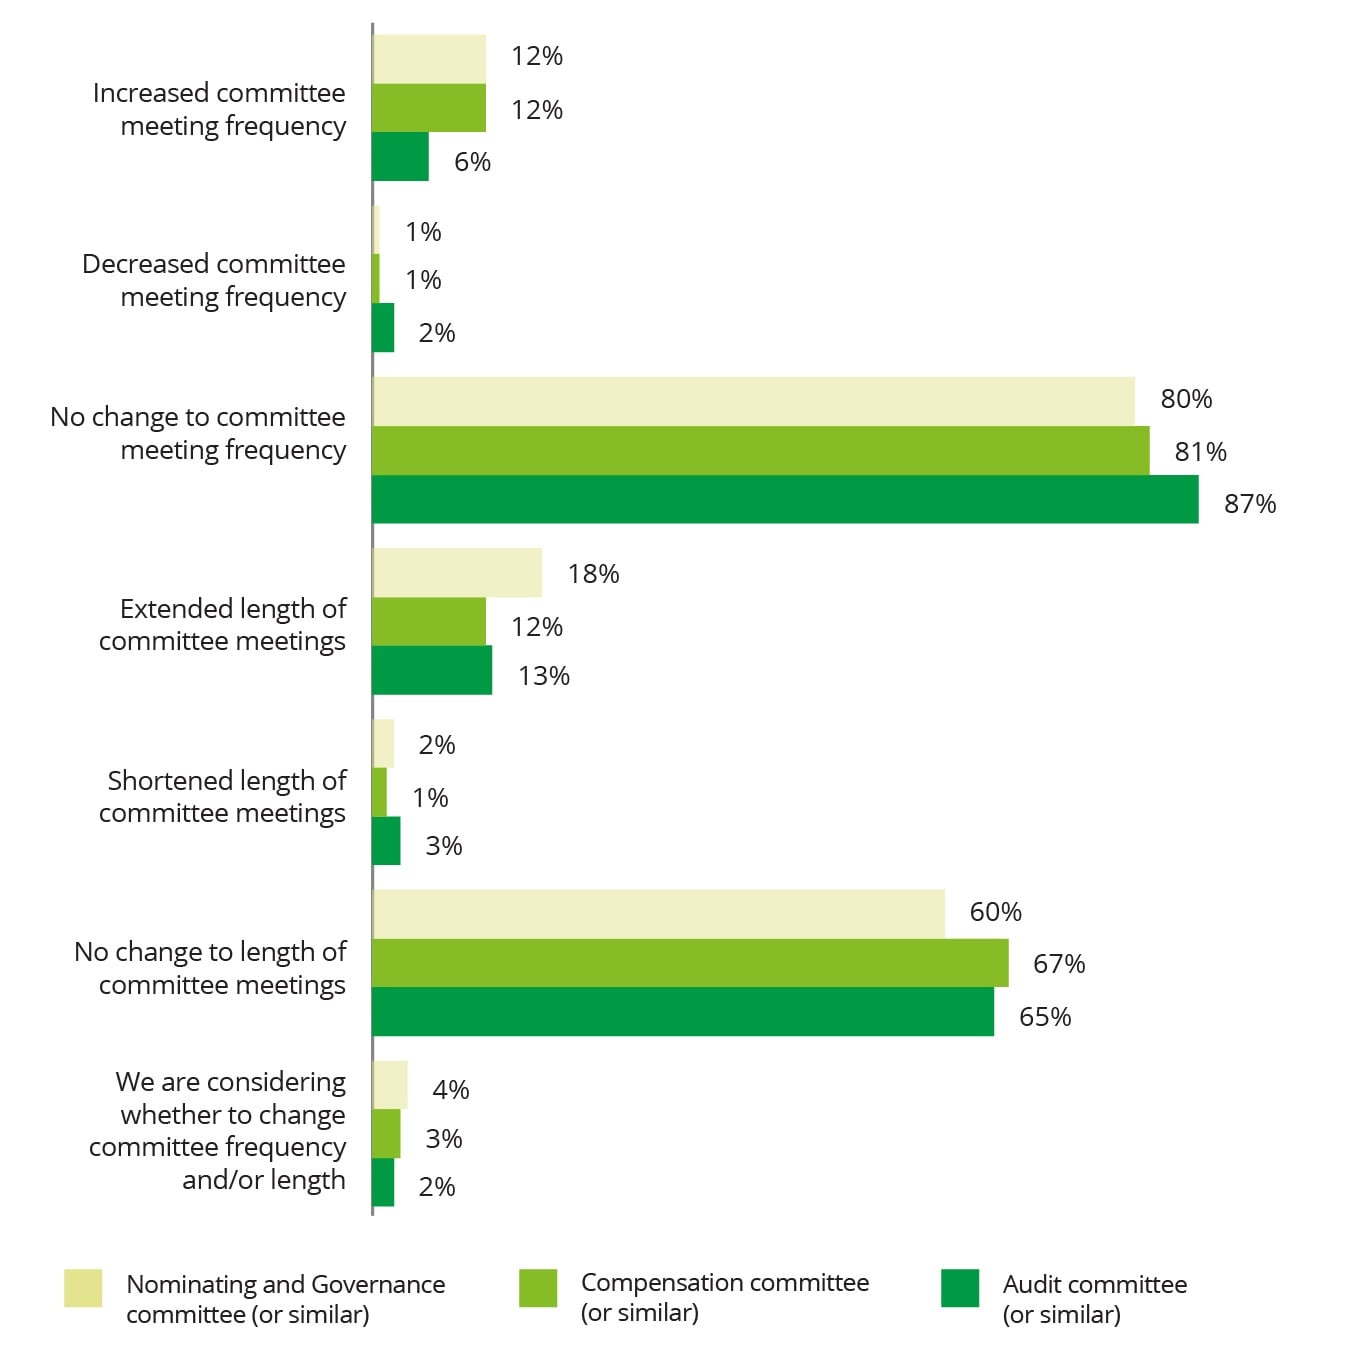
Indicate whether—in the past year—your board has changed the cadence in which its standing committees meet. [Select all that apply] (135 responses)
Across market caps:
- 16% of large-caps increased compensation committee meeting frequency, compared to 10% that did so for the audit committee and 11% for the nominating and governance committee.
- 19% of large-caps increased nominating and governance committee meeting length, compared to 16% that did so for the audit committee and 10% for the compensation committee.
- 3% of mid-caps increased audit committee meeting frequency, compared to 9% that did so for the compensation committee and 11% for the nominating and governance committee.
- 17% of mid-caps increased nominating and governance committee meeting length, compared to 10% that did so for the audit committee and 14% for the compensation committee.
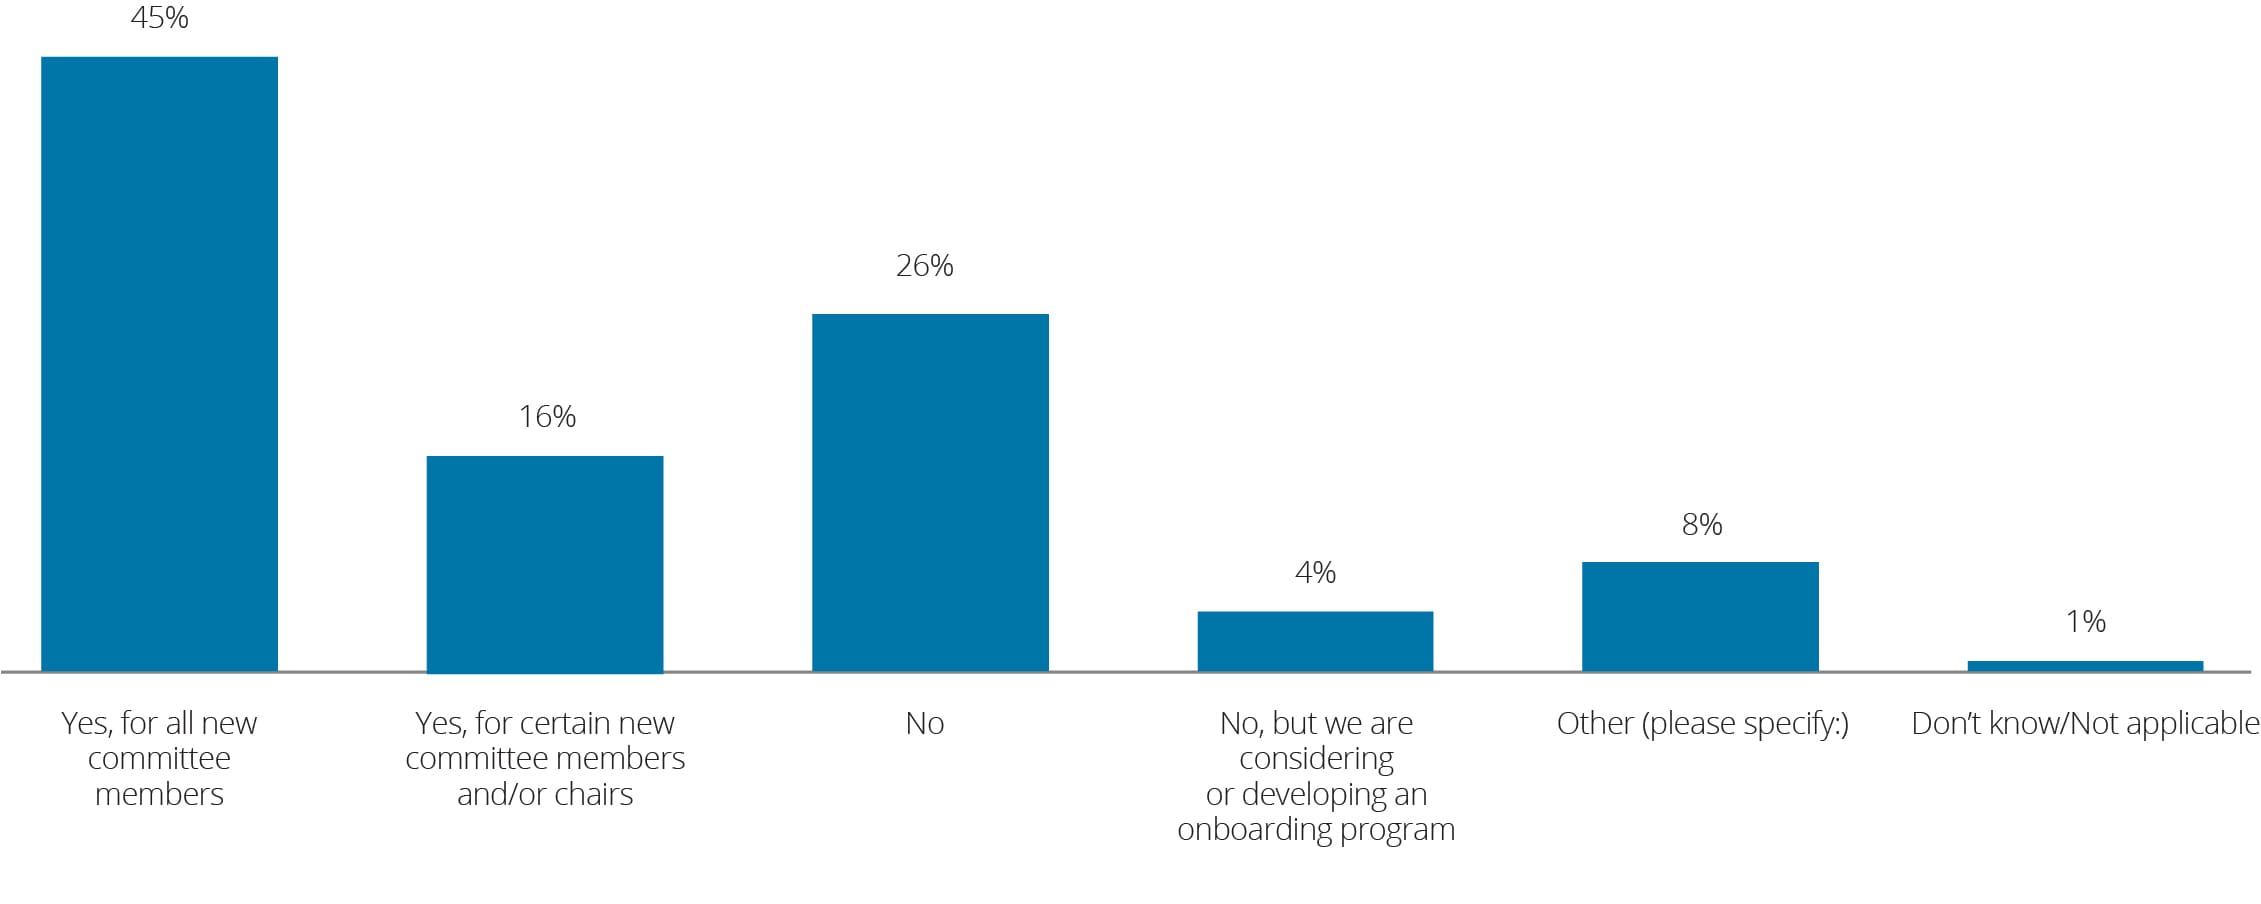
Does your board have an onboarding program for new committee members? (138 responses)
45% reported having an onboarding program for new committee members; however, the prevalence correlates positively with market cap size. Many respondent comments indicated that committee onboarding typically occurs as part of new director onboarding.
End notes
1 Public company respondent market capitalization as of December 2021: 46% large-cap (which includes mega- and large-cap) (> $10 billion); 52% mid-cap ($2 billion to $10 billion); and 2% small-cap (includes small-, micro-, and nano-cap) (< $2 billion). Respondent industry breakdown: 34% energy, resources, and industrials; 28% financial services; 17% consumer; 13% technology, media, and telecommunications; and 7% life sciences and health care.
Small-cap and private company findings have been omitted from this report and the accompanying demographics report due to the limited respondent population.
Throughout this report, in some cases, percentages may not total 100 due to rounding and/or a question that allowed respondents to select multiple choices.
Get in touch

Carey Oven
Enterprise Leader Development & Succession | Deloitte & Touche LLP
Recommendations

Back to basics: Board meetings
Board Practices Quarterly, March 2022
Diversity, equity, inclusion: One year later
Board Practices Quarterly, December 2021