Smart Capital Utilization delivers Capacity and Shareholder value has been saved

Analysis
Smart Capital Utilization delivers Capacity and Shareholder value
Author: Viswanath Anakkara Vadakkath and Deidra DenDanto
Before 2023, semiconductor capex grew by double-digits for three years in a row1. With supply expected to exceed demand in 2023, leading semiconductor manufacturers seem to be focused on maximizing utilization from installed capacity and optimizing reuse of assets to stay cost competitive. This directly plays into reducing cost per wafer, which is important for the growth of manufacturing in the United States, supported by the CHIPS and Science Act, as pressures imposed by US sanctions on China continue.2
What differentiates manufacturing of semiconductor wafers from manufacturing in any other industry is the microscopic scale of device fabrication, the mechanical and chemical manipulation of the wafer substrate, and the minuscule margin of acceptable error. Many aspects of fabrication are dependent on specialized equipment, making the process incredibly capital-intensive. Advanced EUV lithography equipment, for example, can cost more than $150M and take up to a year for delivery and assembly; it is usually operated in specialized clean room environments. These tools can process hundreds of wafers per hour so a delay of just a day against the construction plan or unplanned downtime equates to tens of thousands of dollars in opportunity costs daily3. How can world-class semiconductor manufacturers maximize their ROI from their capital equipment?
This comes down to three capabilities that may be simple to envision, but typically tricky to implement:
- Ability to track equipment status and health
- Ability to align on targets across stakeholder groups
- Ability to consistently drive decisions based on data
Track equipment health
An equipment usually has several stages within its lifecycle: tool spec definition, configuration management, procurement, construction, production, and reuse. Each of these stages has its sub-stages and metrics. Leading semiconductor manufacturers can track industry standard KPIs that they have access to at the click of a button to proactively manage asset health. Asset construction time, standard capital value, percent reuse, and Overall Equipment Effectiveness (OEE) are a few examples. The trick to doing this right often depends on being able to rely on a single source of truth for data (vs reconciliation in offline files/dashboards) and persona-based views where a CEO or an operator would see the same KPIs, but at a granularity that makes sense to them for their decision making.
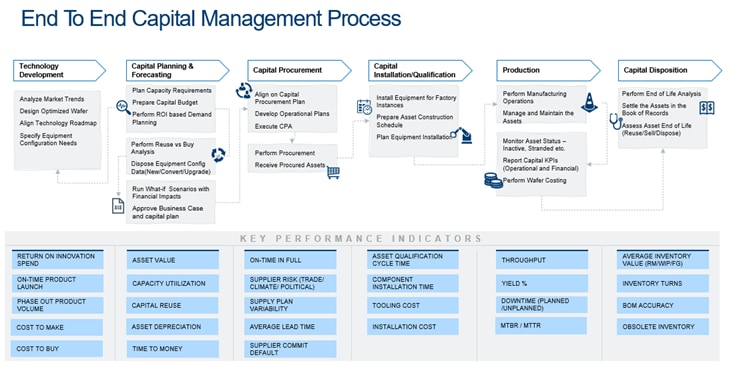
Stakeholder alignment on definitions and targets
Capital equipment management tends to be a process with many layers of ownership, which can complicate governance and accountability. The responsibility to define capacity needs and approve business cases for new assets or movement of assets usually cuts across multiple functions – technology development, finance, procurement, industrial engineering and manufacturing, to name a few. Establishing a clear governance model, where teams can be clear about their role in the capital planning and management process as well as align on definitions and calculations for the prioritized KPIs may be a prerequisite to setting targets. Leading manufacturers have a repeatable process to refresh targets based on industry benchmarks against other IDMs, foundries or OSATs, depending on the market.
Data-driven decision-making loop
Once there’s clear visibility into the asset base, ownership and targets are established, maximizing ROI through data-driven insights becomes easy. A few examples of these important decisions include:
- Planning: Bridging needs across horizons from product-process technology development should have (roadmap alignment) 5 years out to cross-fab utilization levels in the 6-9- month horizon while planning for capital expansions.
- Procurement: Avoidance of new capital purchase through reuse analysis between nodes and sites, vs driving procurement purely on capacity requirements.
- Production: Predict downtime and minimize Mean Time to Repair (MTTR), and Mean Time Between Repair (MTBR) using AI/ML algorithms and control towers to visualize chamber- level performance, vs trying to rely on preventive maintenance schedules.
These are just a few examples of data-driven decision-making, that could lead to operational improvements. These capabilities have proven to generate 5-8% in margin improvements.
Sub-optimal management of semiconductor capital resources could cost organizations millions of dollars in avoidable spending and directly impact bottom-line metrics. True long-term success in efficient deployment and utilization of capital equipment can come from establishing a process that connects these 3 capabilities – make reporting clear, accessible, accurate, and timely, drive meetings and reporting straight from these dashboards, and ensure that planning, procurement, and production decisions have a clear business case. Large organizations could typically fumble and falter with the smooth orchestration of these three pieces of the puzzle.
Deloitte can assist organizations in developing capital capabilities through digital transformation initiatives regardless of the level of maturity. The range of services spans from establishing Global Control Towers for asset visibility, and capital governance processes, to optimizing operations through predictive maintenance, and reuse maximization. Reach out to Deloitte today to find more ways to help maximize utilization and returns from invested capital.
1 See Semiconductor industry capital expenditure 2023 | Statista
2 See Taiwan chip pioneer warns US plans will boost costs | AP News
3 Inside ASML, the company advanced chipmakers use for EUV lithography (cnbc.com)
Get in touch


Christie Simons
Global Semiconductor Center of Excellence Leader | US A&A TMT Leader | Audit & Assurance Partner
Recommendations

Semiconductor expansion may require smart capital spending processes
There are 41 new chip plants being built between now and 2025, requiring over half a trillion US dollars of capital globally

US semiconductor industry needs public-private partnerships for an innovation ecosystem
We need consortia and public-private partnerships to overcome barriers, encourage mutually beneficial collaboration, and maximize investment returns