A culture of belonging.
Our strength comes from the breadth of knowledge, unique experiences, and perspectives of our people, who are our greatest asset.
Everyone is welcome at Deloitte, and we are committed to fostering an inclusive culture - helping all our people thrive and reach their full potential.
This is a place where you’re cared for as an individual and celebrated for who you uniquely are. Where you are given the tools you need to grow, thrive, and lead.
Here, you’re empowered to think bigger. Go further. Exceed even your own expectations.
You create positive change for clients, colleagues, and communities. We’re in it together - and we’re stronger because of it.
Deloitte. Discover your impact.
Together, we're better
25 years as a Fortune 100 Best Companies to Work For®. How did we do it? Our professionals all seem to agree: It’s the people.
Discover your impact
Our culture is about high performance, opportunity, and belonging, and we are proud to be recognized as a culture that fosters collaboration and inspires you to be your best.
Embracing our values
We are grounded in our shared values of leading the way, serving with integrity, taking care of each other, fostering inclusion, and collaborating for measurable impact every day.

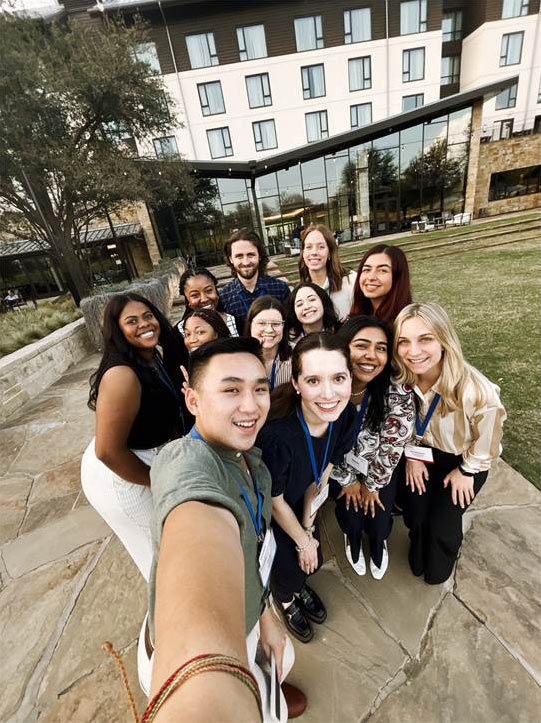
Strong sense of belonging
Our environment is one of belonging, where our people feel valued, connected, and supported. We offer networking, mentorship, and learning and development opportunities for all our professionals.
Taking care of each other
We care about our employees. That's why rather than just say it, we show it. Taking care of our people is our priority because working for Deloitte should work for you. We deliver a distinctively Deloitte experience that is intended to empower you to thrive mentally, physically, and financially, and care for your well-being.
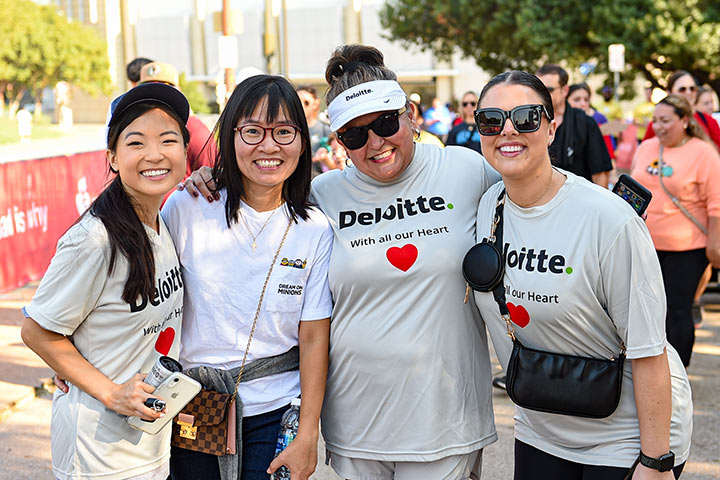
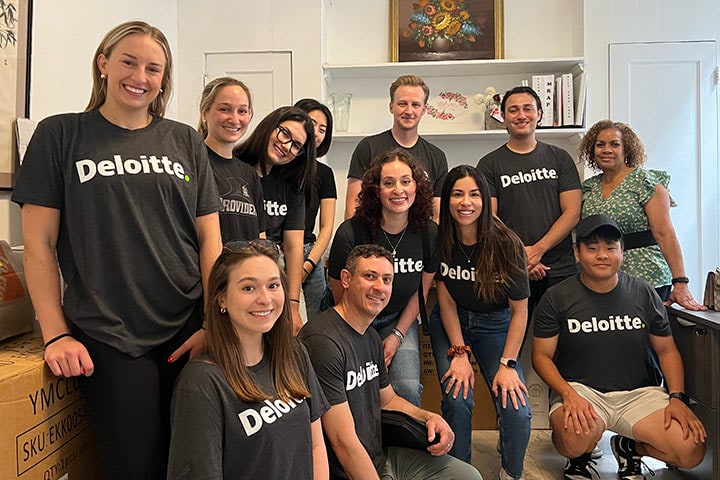
Making an impact that matters
Volunteering can make us happier, healthier, and more hopeful. And it can do the same for the world. That’s why annually, we come together for Impact Day, so we can make a positive impact for ourselves and our communities.
Connections at Deloitte
We understand that genuine connection can extend beyond communication. By embracing who we uniquely are, we can cultivate a culture of belonging. Our National Communities are open to all of our people, offering shared spaces to gather, connect, and learn from one another, and continue to foster a supportive environment.

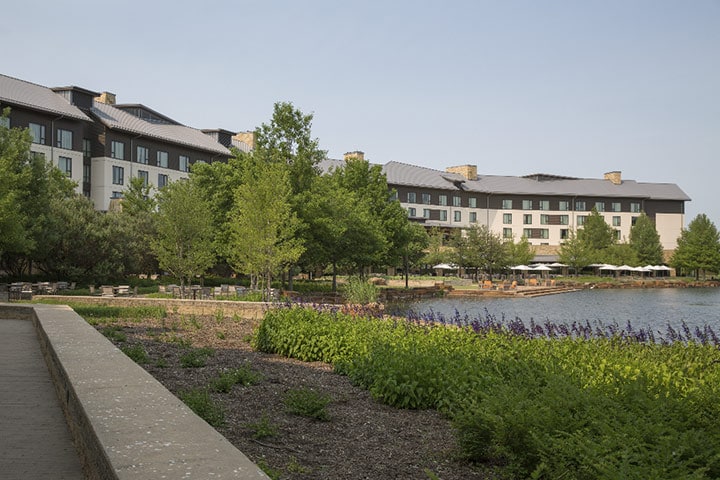
Growing leaders
Deloitte University is one of the most visible and important investments we make in our people. It’s where learning meets leadership. It allows our people, our clients, and our communities to reach their fullest potential.